Automate Google Analytics Reports and Reclaim Your Week

So, you want to get your Google Analytics reports on autopilot? Smart move. You can do it with a few tricks: use the built-in scheduled emails, connect to Looker Studio for dashboard delivery, or bring in third-party tools that handle the whole shebang—creation, customization, and white-labeled distribution.
The goal? To stop wasting hours on manual data pulls and start getting insightful updates delivered to you, freeing you up for more important things. Like that extra cup of coffee.
Your Weekly Reporting Nightmare Is Officially Over
Let's be real. Nobody's favorite Monday morning ritual involves wrestling with spreadsheets to manually yank data out of GA4. We've all been there, burning hours trying to make sense of a million metrics, especially since the big, chaotic switch from Universal Analytics.
For an agency juggling a handful of clients, this soul-crushing task can easily gobble up 15-20 hours a week. That’s time you should be spending on actual strategy, not copy-pasting numbers. This guide is your escape plan. Moving from manual chaos to automated clarity isn't just a nice-to-have; it's a sanity-saving necessity for any modern marketer.
The Great GA4 Migration Mess
When Universal Analytics shut down on July 1, 2023, it forced a massive and, frankly, messy shift to Google Analytics 4 (GA4) for millions of websites. With a report from SEOclarity showing only about 30% of sites fully transitioned before the deadline, a lot of teams were left scrambling.
This change didn't just make compiling metrics more time-consuming; it also shined a huge spotlight on the need for a better way. Today, over 64% of marketers use automation for these exact tasks, slashing their reporting time by more than 80%, according to research by Invesp.
This guide will walk you through setting up systems that deliver insightful, professional reports on autopilot.
Key Takeaway: The whole point is to turn you from a reactive data-puller into a proactive strategist who has the time to figure out what the numbers actually mean for the business.
Why Automation Is Your New Best Friend
Automating your reports does way more than just save time—it enforces consistency and kills the chance of human error. No more copy-paste mistakes or that cold-sweat moment when you realize you sent last month's numbers to a key stakeholder. Yikes.
Get Your Time Back: Free up hours every single week to focus on high-impact work like campaign optimization and client strategy.
Improve Accuracy: Automated systems pull the same metrics the same way, every time. Your data becomes rock-solid reliable.
Scale Your Efforts: Easily manage reporting for dozens of clients or internal teams without your workload exploding.
To truly banish the reporting nightmare, you need a solid grasp of the principles behind data collection and analysis. A great starting point is understanding What Is Website Analytics. Knowing the 'why' behind the 'what' makes your automated reports infinitely more powerful.
Choosing Your GA4 Automation Method
Alright, you're sold on the idea of putting your reporting on autopilot. But when you start looking at the options, it can feel a little overwhelming—like standing in the cereal aisle on a Saturday morning with way too many choices. Where do you even start?
Let's break it down into four main approaches. They range from the free-and-fiddly to the truly set-it-and-forget-it solutions that let you reclaim your week. The right path for you really comes down to your budget, your technical comfort level, and how many reports you need to wrangle.
The choice is pretty simple when you visualize it. You can either stick with the grind of manual reporting or step into the clarity of automation.
The manual path is a direct route to lost hours. Automation, on the other hand, leads to consistent, clear insights without the weekly headache.
Let’s dig into what each method actually looks like in practice.
Native GA4 Sharing Features
Google Analytics 4 has a built-in "Share report" feature. Think of this as the most basic option on the menu—it’s quick, easy, and totally free. With a few clicks, you can export any standard or custom report as a PDF or CSV and even set up recurring emails.
But here's the catch: it's not true automation in a scalable sense. The customization is extremely limited, you can't add your own branding (white-labeling), and trying to manage this for more than a couple of clients quickly becomes a new kind of manual chore. It’s perfect for a one-off share but falls short for professional, recurring client reporting.
Looker Studio Scheduled Dashboards
This is probably the most popular free method to automate Google Analytics reports. Looker Studio (formerly Google Data Studio) lets you build visually impressive dashboards that pull data directly from GA4 and other sources. Once your masterpiece is built, you can schedule it to be sent as a PDF attachment via email.
It’s a huge step up from the native feature, offering far more control over what your reports look like. The downside? You still have to build everything from scratch. And when a data connection inevitably breaks or an API updates, you're the one on the hook to fix it. Plus, the reports are delivered as static PDFs, which isn't always the most engaging format for a client to receive.
The DIY Route With the GA Reporting API
For the code-savvy heroes out there, the Google Analytics Reporting API is your playground. This approach gives you absolute maximum flexibility. You can pull exactly the data you want and pipe it into any system you can imagine—a custom dashboard, a Google Sheet, or even a data warehouse like Amazon Redshift.
The big trade-off here is the time and technical skill required. You'll be spending 80% of your time on the tedious assembly process and only 20% on actually analyzing what the data means. It’s incredibly powerful, but make no mistake, it’s a full-on development project.
Dedicated Third-Party Tools
This is the set-it-and-forget-it option. Tools like MetricsWatch are built from the ground up to solve this exact problem. They connect directly to your GA4 account and handle everything—data consolidation, template creation, scheduling, and even white-labeling with your agency’s branding.
While this is a paid option, the return on investment comes from the massive amount of time you get back. We actually have a guide on creating powerful Google Analytics reports that shows just how much a dedicated tool simplifies the whole process.
If you want to understand the core concepts behind this, checking out a guide on what is marketing automation can be a huge help. Ultimately, this approach is designed for agencies and marketers who need to scale their reporting efficiently and professionally without getting bogged down in the technical weeds.
Comparison of Google Analytics Automation Methods
To make the decision a bit easier, here’s a head-to-head look at how these four methods stack up against each other based on what matters most to agencies and marketers.
| Method | Best For | Cost | Technical Skill | Scalability |
|---|---|---|---|---|
| Native GA4 Sharing | Quick, one-off internal shares. | Free | None | Very Low |
| Looker Studio | Custom visual dashboards for a few clients. | Free | Low-Medium | Medium |
| GA Reporting API | Fully custom, large-scale data solutions. | Free (dev time) | High | High |
| Third-Party Tools | Agencies and marketers needing scalable, professional client reporting. | Paid (SaaS) | None | High |
Each path has its place. Your job is to pick the one that aligns with your resources, goals, and the number of clients you need to keep happy.
Alright, theory is great, but let's get our hands dirty.
How do you actually go from zero to a fully automated, beautiful, white-labeled report landing in your client's inbox every Monday morning? Spoiler: you don’t need a spreadsheet or a single line of code.
We'll use a dedicated tool built for this exact purpose to show just how simple it can be. The goal is to set up a system that makes you look like a reporting wizard, even if all you're doing is clicking a few buttons.
This whole process is designed to take the manual grunt work out of your week. You can finally focus on what the numbers actually mean instead of just gathering them. The less time you spend assembling data, the more time you have for strategy—which, let's be honest, is what clients really pay for.
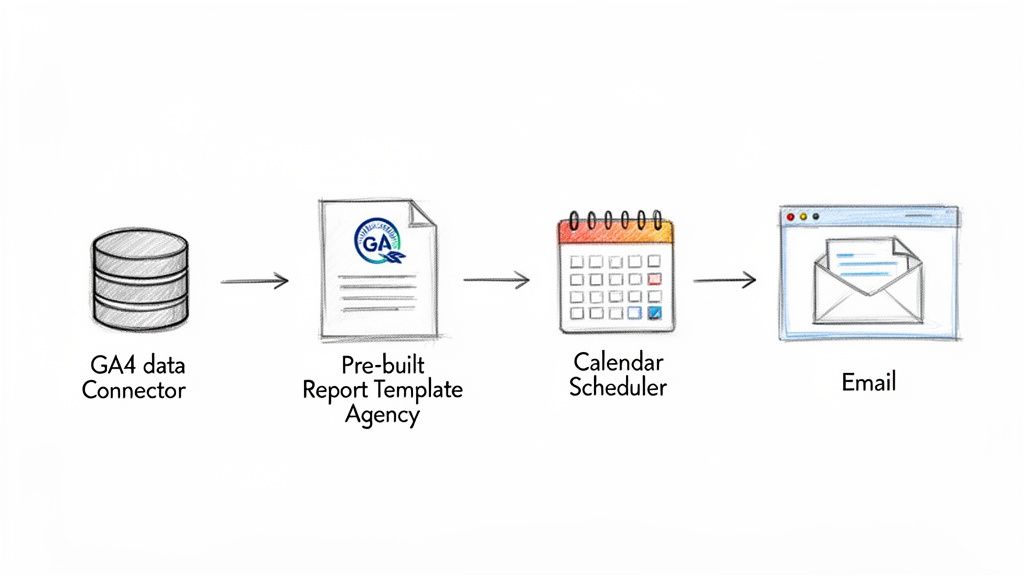
Hook Up Your Data Sources
First thing’s first: you need to give the tool permission to talk to your Google Analytics account. This usually just means logging into your Google account and clicking "Allow." Simple enough.
But the real magic happens when you connect all your marketing channels. A truly great automated report isn't just a GA4 data dump; it's a complete performance story. You can (and should) pull in data from places like:
Google Ads to show how campaigns are driving traffic and conversions.
Facebook Ads to highlight social media ROI.
Mailchimp to connect email marketing efforts to website activity.
LinkedIn Ads for all your B2B campaign tracking.
Getting all these sources into a single view is a game-changer. It stops clients from having to piece together five different reports just to get a clear picture of what's working.
Pick a Template and Make It Yours
Starting from scratch is a massive time sink. The smart move is to use a pre-built template designed for a specific purpose, like a monthly marketing overview or an e-commerce performance deep-dive.
From there, you can quickly build out a report by dragging and dropping the exact metrics you need from your different integrations. No more hunting for the right data point.
This drag-and-drop approach lets you create a completely custom report in minutes, not hours.
Once you have your metrics dialed in, the next step is branding. White-labeling is non-negotiable for agencies. Add your client’s logo, pop in your own agency branding, and customize the color scheme. The end result is a professional report that looks like it was custom-built just for them.
Pro Tip: Don't just stop at adding a logo. A killer move is to include a custom comments section in your template. This gives you a dedicated spot to add your own analysis and key takeaways each week, transforming the report from a data summary into a strategic asset.
Set the Schedule and Walk Away
This is the final, glorious step. Instead of wrestling with PDFs and email attachments, you just set a recurring schedule and you're done.
Daily: Perfect for fast-moving e-commerce sites that need to track sales.
Weekly: The classic Monday morning send for most marketing clients.
Monthly: A great option for high-level executive summaries.
You can even set up multiple schedules for different stakeholders, all from the same report. If you want more ideas on this, you might find our guide on how to send Google Analytics marketing reports by email the right way helpful.
And that's it. Your reports will now be created and delivered automatically, freeing you up to do the work that actually moves the needle.
Go Beyond Reports with Proactive Anomaly Alerts
Scheduled reports are fantastic for tracking progress and spotting trends. I get it. But let’s be honest, they’re entirely reactive.
A sudden 50% drop in traffic on a Tuesday isn't something you want to discover in next Monday’s summary report. By then, the damage is done and you're left explaining what went wrong days after the fact.
This is where proactive monitoring completely changes the game. It’s the difference between reading a history report and getting a live news alert. When you automate Google Analytics reports, you should absolutely layer in a system to watch your data for you, 24/7.
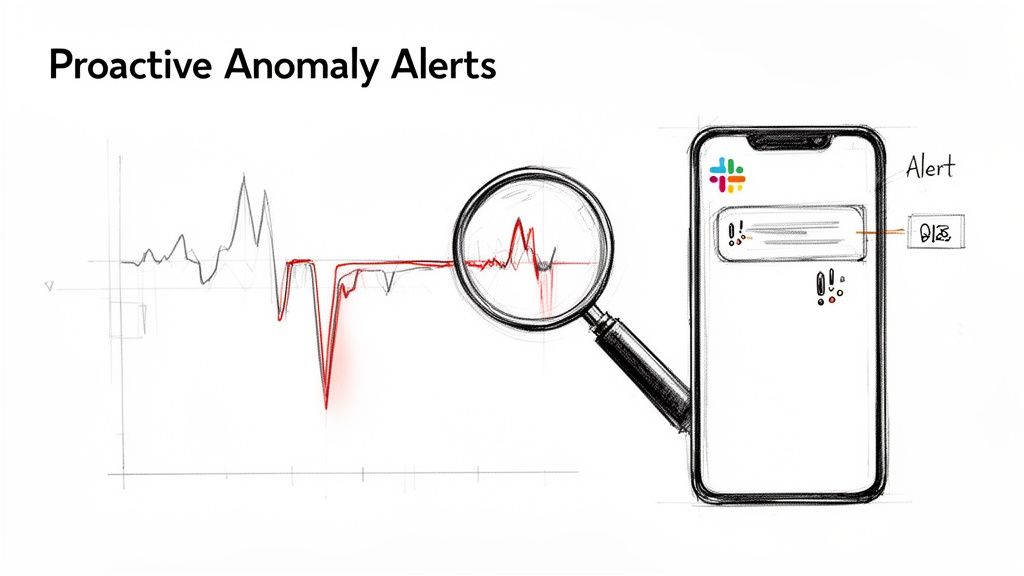
This simple shift moves you from being a reactive analyst who explains what happened to a proactive strategist who spots and fixes issues as they happen.
From Reactive to Proactive Monitoring
Think about the real-world disasters that can sink a campaign or torpedo your revenue. These aren't subtle, week-over-week declines; they're sudden, catastrophic failures that demand immediate attention.
Anomaly alerts act as your digital smoke detector. You don’t check it weekly to see if there was a fire last Tuesday; it screams the moment it detects a problem. This is a crucial layer to add on top of any standard reporting schedule.
Some of the most critical events you need to be monitoring include:
A sudden spike in 404 errors: This could mean a popular page was unpublished by accident or a broken link is being blasted out in a major campaign.
A sharp dip in e-commerce conversions: Is the checkout button broken? Did a recent update kill your payment gateway integration?
An unexpected drop in organic traffic: Did a technical SEO issue get your site de-indexed from Google?
Zero traffic from a key campaign: Maybe the UTM parameters are wrong, or worse, the campaign isn’t even running.
Getting a Slack or email notification the moment your e-commerce checkout flow breaks is infinitely more valuable than finding out days later after losing thousands in sales.
Waiting for a weekly report to tell you that your website has been down for three days is like getting a letter in the mail informing you that your house is on fire. Proactive alerts are the 911 call you need to solve the problem immediately.
Setting Up Your First Anomaly Alert
The good news is that setting up these alerts is surprisingly straightforward. Many third-party tools are designed specifically to connect to your GA4 account and watch for these problems without any complex configuration on your part.
For example, you can set an alert to trigger if "Total Revenue" drops by more than 75% compared to the previous day. That single alert could save you from a weekend of lost sales due to a silent technical failure.
The best part is that a good alert system filters out the noise. It should be smart enough to distinguish between a real problem and normal daily fluctuations, so your phone isn't blowing up with false alarms. You can learn more about setting up the most impactful notifications by exploring these top 5 Google Analytics alerts.
By combining automated reporting with proactive anomaly detection, you create a complete analytics governance system. Your scheduled reports keep stakeholders in the loop, while your real-time alerts protect your bottom line.
Avoiding Common GA4 Reporting Mistakes
Setting up a system to automate Google Analytics reports is a huge time-saver. But let's be honest, automating a bad report just means you get bad data, faster. It’s like putting a brand-new engine in a car with square wheels—you're moving, but you're not getting anywhere useful.
The good news is most of these reporting mistakes are easy to sidestep once you know what to look for. Let’s walk through the classic blunders that can turn a beautiful, automated report into just more noise in your inbox.
Ditching Vanity Metrics for What Actually Matters
The biggest trap in reporting is falling in love with "vanity metrics." These are the numbers that look impressive on the surface but don't actually tell you a thing about the health of your business. Think of them as the sugar rush of data—it feels good for a second, then you crash with nothing to show for it.
A classic example is obsessing over total sessions. Sure, a huge number of sessions looks great, but what if 90% of those people bounced in three seconds? In GA4, the much smarter metric to track is Engaged Sessions. This counts users who actually stuck around for more than 10 seconds, triggered a conversion, or visited at least two pages. It’s the difference between counting window shoppers and people who actually walked into your store.
Your automated reports need to zero in on metrics that tie directly to business goals:
Instead of just Users, track New vs. Returning User Conversion Rates.
Instead of Pageviews, focus on Engagement Rate and Conversions by Landing Page.
Instead of the old Bounce Rate, use its much more insightful successor, Engagement Rate.
The Golden Rule: If you can't look at a metric and immediately know what action to take, it might be a vanity metric. Every single number in your report should be there to answer a specific business question.
Giving Your Data Some Much-Needed Context
Another all-too-common pitfall is looking at data in a vacuum. So, you got 5,000 organic sessions last month. Is that good? Bad? Who knows! Without context, your numbers are just trivia. This is where benchmarking becomes your secret weapon.
Benchmarking shows you how your performance stacks up against industry averages, giving your data critical meaning. For example, Google Analytics benchmarking data shows that top-performing websites typically see 45-60% of their sessions from organic search. If your automated report shows your organic traffic is hovering around 20%, you immediately know you have a problem to solve. No guesswork required.
You can dig into more of these insights by exploring industry benchmarks on Databox.com to see how your numbers really compare.
Setting Up Failure Notifications
Okay, so you’ve built the perfect automated report. It's beautiful, insightful, and scheduled to hit inboxes every Monday morning. But what happens if the data connection breaks on Tuesday? You'll be flying blind for a whole week, and your next report will be full of zeroes.
This isn't some hypothetical problem; data sources break all the time. An API key expires, a platform updates its authentication method, or sometimes, gremlins just get into the system. Whatever the cause, you need to know about it instantly.
Any robust automation setup absolutely must include failure notifications. If a report fails to generate or a data source gets disconnected, you should get an immediate email or Slack alert. This simple backstop ensures your reports are consistently accurate and saves you from the embarrassing moment of sending a broken report to a client or your boss.
Frequently Asked Questions (The No-Fluff Edition)
Got questions? Good, because I’ve got answers. Let’s cut through the noise and tackle the most common head-scratchers people have about automating their Google Analytics reports. No fluff, no jargon—just straight answers so you can get started with confidence.
Can I Automate GA4 Reports for Free?
You absolutely can. Google’s own Looker Studio is a powerful free tool for building dashboards that you can schedule as PDF email exports. Another route a lot of folks take is the '[GA4 Reports for Google Sheets](https://workspace.google.com/marketplace/app/ga4_reports/10 GA4 reports)' add-on, which lets you pipe data directly into a spreadsheet.
Both of these get the job done, but be prepared to roll up your sleeves. They require a decent amount of manual setup and ongoing maintenance compared to paid tools. That said, if you're on a tight budget and don't mind tinkering a bit, they're a fantastic starting point.
How Do I Handle Reporting for Multiple Clients?
This is where dedicated third-party tools really earn their keep and save you from a world of hurt. Trust me, trying to manage dozens of individual Looker Studio reports for different clients quickly spirals into an unmanageable mess of broken links and outdated files. It's a logistical nightmare waiting to happen.
A specialized tool lets you create one master template and then apply it across all your clients. You can fully white-label each report with their specific branding and data. This is a massive time-saver that lets you scale your agency's reporting without scaling your workload (or your caffeine intake).
The Agency Reality: Most agencies spend 80% of their time just wrestling with data and assembling reports. That leaves only 20% for actually analyzing what the numbers are trying to tell you. Automation flips that ratio on its head.
What Are the Most Important Metrics to Include?
My best advice? Focus on outcomes, not just activity. Instead of just showing "Sessions," you should be reporting on "Engaged Sessions." Don't just show a total "Users" number; break it down into "New vs. Returning Users" to see who's actually sticking around.
Your go-to metrics should almost always include:
User Engagement: How many people are actually interacting with your site in a meaningful way?
Traffic Acquisition by Channel: Where is your best, most valuable traffic really coming from?
Conversions by Goal Name: Are people doing the things you want them to do? (Think sign-ups, downloads, etc.)
Key E-commerce Metrics: If it’s a store, nothing matters more than total revenue and conversion rate.
But here’s the most important part: always, always tailor the report to what the client actually cares about. Everything else is just noise.
How Often Should I Schedule My Reports?
It really depends on who's reading it. A hands-on marketing manager will probably love a weekly report hitting their inbox on Monday morning to help plan the week ahead. But for a C-level executive, a high-level monthly summary is often more than enough to keep them in the loop without drowning them in data.
For critical e-commerce sites where every hour counts, daily reports on sales and conversions might be necessary. The beauty of automation is that you can set different schedules for different audiences without any extra effort on your part.
Ready to stop wrestling with spreadsheets and start automating your client reporting? With MetricsWatch, you can build and deliver beautiful, white-labeled reports from all your marketing channels in minutes. Start your 14-day free trial today and see how much time you can get back.


