Automated Marketing Reports: The Ultimate Guide to Not Hating Your Job

Let's be real: manually creating marketing reports is a soul-crushing task. It feels like a punishment for a crime you don't remember committing—a miserable cycle of exporting data, fighting with spreadsheets, and triple-checking formulas, only to do it all over again next week.
Consider automated marketing reports your official get-out-of-jail-free card. Think of them as a tireless data assistant who delivers perfect insights, right on schedule, without any of the pain.
Escaping the Spreadsheet Black Hole
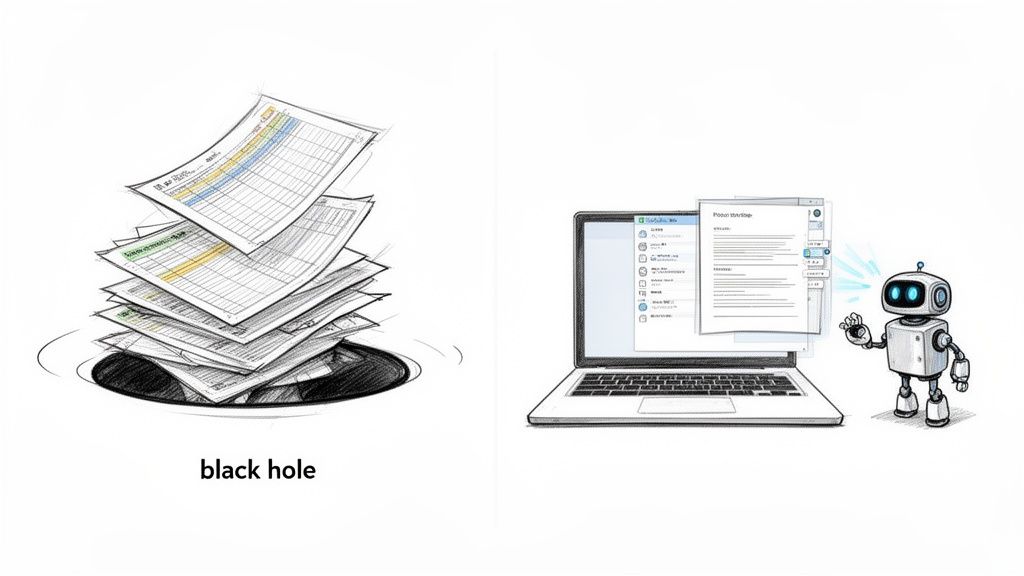
If you've ever felt the Sunday Scaries creeping in because you know Monday is "report day," you're not alone. The manual reporting process is a notorious time-sink.
Marketers and analysts burn hours just logging into different platforms, downloading CSVs, and pasting data into monstrous spreadsheets. It’s no surprise that, according to a report by Forrester, data professionals spend up to 40% of their time just gathering and preparing data before they can even analyze it. Imagine getting two days of your week back!
This manual drudgery isn’t just boring; it’s a recipe for disaster. Human error is almost guaranteed when you're juggling dozens of metrics from social media, web analytics, and ad platforms. A single copy-paste mistake can skew your data, leading to bad decisions and awkward conversations with your boss or clients.
Your Tireless Data Assistant
Imagine having a new best friend—one who loves data entry, works 24/7, and never asks for a day off. That’s an automated marketing report.
This technology uses APIs (think of them as digital messengers) to automatically pull the latest data from all your marketing channels. It then organizes everything into a clean, easy-to-read report and sends it straight to your inbox.
What does this really mean for you?
- More Time for Strategy: Instead of spending your day compiling data, you can finally focus on analyzing it and making smart decisions.
- Fewer "Oops" Moments: Automation gets rid of the human errors that sneak into manual reports, which builds trust with stakeholders.
- Happier Weekends: Say goodbye to late nights and weekend work spent wrestling with spreadsheets. Your reports are built and sent while you sleep.
By removing manual labor from the reporting process, marketers and analysts get more time to research acquired insights and concentrate on decision-making.
Proving Your Value Without the Pain
For frantic agency owners and overworked in-house marketers, the biggest win is finally being able to prove your value without the headache. Consistent, professional reports packed with accurate data show clients and executives exactly how your efforts are paying off.
You can highlight wins, spot opportunities, and tell a compelling story about your marketing performance. If you're already using a tool but looking to switch, a reporting tool migration service can make the transition painless.
Ultimately, automated marketing reports are your ticket out of the spreadsheet black hole. It’s about trading mind-numbing repetition for strategic freedom, letting you focus on what actually matters: growing the business.
Why Automation Is Your Reporting Secret Weapon
Let’s be honest, nobody enjoys pulling reports. But what if that tedious task could become your greatest strategic advantage? Sure, automation saves a ton of time, but its real superpower is building something far more valuable: trust.
Manual reporting is a minefield of "oops" moments. One misplaced decimal or a forgotten data point, and suddenly you're scrambling to explain the numbers. These tiny mistakes can quietly erode confidence with clients and executives.
Automated marketing reports take human error out of the equation, delivering consistent, laser-accurate data every single time. This reliability transforms reporting from a chore into a powerful trust-building exercise. When stakeholders know your numbers are solid, the conversation shifts from questioning your data to acting on your strategy.
Make Smarter Decisions Faster
In marketing, speed is everything. A small dip in conversions or a sudden spike in ad costs can spiral into a big problem if you don't catch it right away. If you're waiting a week—or even a month—for a manual report, you're always reacting to old news.
Automated reports give you a real-time pulse on performance. With fresh data at your fingertips, you can:
- Spot trends as they happen. See what’s working and double down on it before the opportunity disappears.
- Fix problems instantly. Pivot your strategy at the first sign of trouble, not after the damage is done.
- Answer questions with current data. When your boss asks how a campaign is doing, you have up-to-the-minute answers.
This isn't just about being more efficient; it's about being more agile. Tapping into real-time business intelligence and automated reporting is like swapping a paper map for a live GPS. You stop driving by looking in the rearview mirror and start navigating what’s ahead.
Timely, accurate data allows you to pivot strategies before tiny issues become costly problems. It's about making smarter decisions with information that’s always current and always correct.
The Clear Impact on Business Growth
Connecting automation to your bottom line isn’t a stretch—it’s a straight line. The global marketing automation market is projected to reach over $16 billion by 2030, according to Next Move Strategy Consulting, for a simple reason: it delivers serious returns. On average, companies using marketing automation see revenues jump by 34% (Invespcro).
For agencies juggling multiple clients, this means finally ditching the spreadsheet drudgery to focus on high-value work. The time you save has a ripple effect across the entire business. You spend fewer billable hours on mundane tasks, freeing up your team to focus on strategy and creativity—the kind of work that actually grows accounts.
Better, faster insights lead to more effective campaigns, which directly improves client retention. When clients see consistent, professional reports that clearly show their ROI, they're not just happy; they're loyal. For more on this, check out our guide on the top reasons to start using automated reporting.
Ultimately, automated marketing reports aren't just a workflow upgrade. They're a core part of a modern growth strategy that directly boosts efficiency, strengthens client relationships, and drives revenue.
Designing Reports People Actually Want to Read
Let’s be brutally honest: most marketing reports are digital dust collectors. They land in an inbox with a soft thud, get skimmed for ten seconds (if they're lucky), and are promptly archived forever.
A report nobody reads is just a waste of everyone's time. So, how do you build automated reports that people actually look forward to getting?
The secret isn't cramming more data onto the page. It's about telling a clear, compelling story that connects with your specific audience. It's time to transform raw data into a narrative of wins, opportunities, and undeniable value.
Speak Their Language with the Right KPIs
Your CEO and your social media manager live in completely different worlds. Sending them the same report is like trying to have a single conversation about astrophysics and TikTok trends—it’s just not going to work for either of them.
Customizing KPIs for each stakeholder isn't just a nice-to-have; it's non-negotiable. It shows you understand what they care about and that you respect their time.
- For the C-Suite: They need the 30,000-foot view. Stick to high-level metrics that tie directly to the bottom line, like Customer Acquisition Cost (CAC), Return on Ad Spend (ROAS), and Marketing-Sourced Revenue. They want to know if marketing is making money, not how many likes last Tuesday's post got.
- For the Marketing Manager: This is where you can zoom in a bit. Think conversion rates, lead quality, channel performance, and cost per lead. They need to see what’s working and what isn’t to steer the ship and optimize campaigns.
- For the Specialist (SEO, PPC, Social): Now you can really get into the weeds. An SEO specialist lives and breathes organic traffic, keyword rankings, and backlink growth. Your PPC manager is obsessed with Click-Through Rate (CTR), Cost Per Click (CPC), and Quality Score.
Tailoring your automated marketing reports this way turns them from generic data dumps into personalized, must-read updates. For a deeper dive, check out our guide on marketing report design best practices for 2025.
The Magic of Templates and White-Labeling
Imagine getting a report from your marketing agency that looks completely different every single month. It would be confusing, unprofessional, and honestly, a little chaotic. This is where templates become your best friend.
A consistent template creates a predictable, easy-to-digest experience. Stakeholders know exactly where to find the numbers they care about, making the whole thing feel familiar and accessible. A big part of this involves mastering reports and dashboards in Salesforce or similar platforms to build these repeatable structures.
For agencies, white-labeling is a total game-changer. It lets you slap your own logo and brand colors on the report, stripping away the tool's branding. It’s a subtle but powerful way to look polished and reinforce your value with every single send.
Finding the Perfect Delivery Cadence
So, how often should you hit "send"? Too often, and you risk "report fatigue"—that dreaded state where people's eyes glaze over and your emails go straight to the archive folder. Too rarely, and stakeholders are left in the dark, unable to make timely decisions.
It’s all about finding the right balance.
- Daily: This is usually overkill unless you're in the middle of a massive product launch or a full-blown crisis. Daily check-ins are best for internal teams watching hyper-sensitive metrics like a hawk.
- Weekly: This is the sweet spot for most marketing teams and their direct managers. It provides a regular pulse on performance, allowing for quick adjustments without drowning everyone in data.
- Monthly: This cadence is perfect for C-level executives and clients. They need a high-level summary of performance and progress toward the big goals, not the nitty-gritty details. Monthly reports should focus on trends and the bigger picture.
By picking the right KPIs, leaning on consistent templates, and setting a smart delivery schedule, you can finally create automated reports that don't just get sent—they get read, understood, and actually acted upon.
Connecting Your Data Without the Technical Headache
Let’s be honest, your marketing data is probably all over the place. You’ve got Google Analytics holding down web traffic, Facebook Ads reports in another tab, and maybe a Shopify dashboard open somewhere else. Trying to piece it all together feels like herding cats in a thunderstorm—it's chaotic, frustrating, and you’re probably not getting the full picture.
So, how do you bring it all under one roof without pulling your hair out? The magic word is integration. This is just the process of getting all your separate apps to talk to each other, creating a single, beautiful stream of information.
The good news? You don't need a computer science degree anymore. Modern tools have turned this once-technical nightmare into a simple point-and-click affair.
The Secret Life of APIs
Ever wondered how your reporting tool magically pulls in data from Facebook? It’s all thanks to something called an API, which stands for Application Programming Interface.
Think of an API as a friendly waiter at a restaurant. You (the reporting tool) tell the waiter (the API) what you want from the kitchen (Facebook's data). The waiter takes your order, brings it back exactly as you requested, and you never have to step foot in the kitchen yourself. It really is that simple.
APIs are the unsung heroes that allow automated marketing reports to connect to all your favorite platforms, from Google Search Console to your e-commerce store. They do all the heavy lifting behind the scenes.
Creating Your Single Source of Truth
The end goal here is what we call a "single source of truth." That’s just a fancy way of saying all your important marketing data lives in one place, giving you a complete, panoramic view of your performance. No more logging into ten different dashboards every morning.
By pulling data from every channel into one unified report, you eliminate data silos and finally see how different parts of your strategy impact each other. You can instantly connect the dots between your social media ad spend and your website's conversion rate.
This whole process boils down to a few simple steps: picking your key metrics, customizing the look and feel, and then setting a delivery schedule.
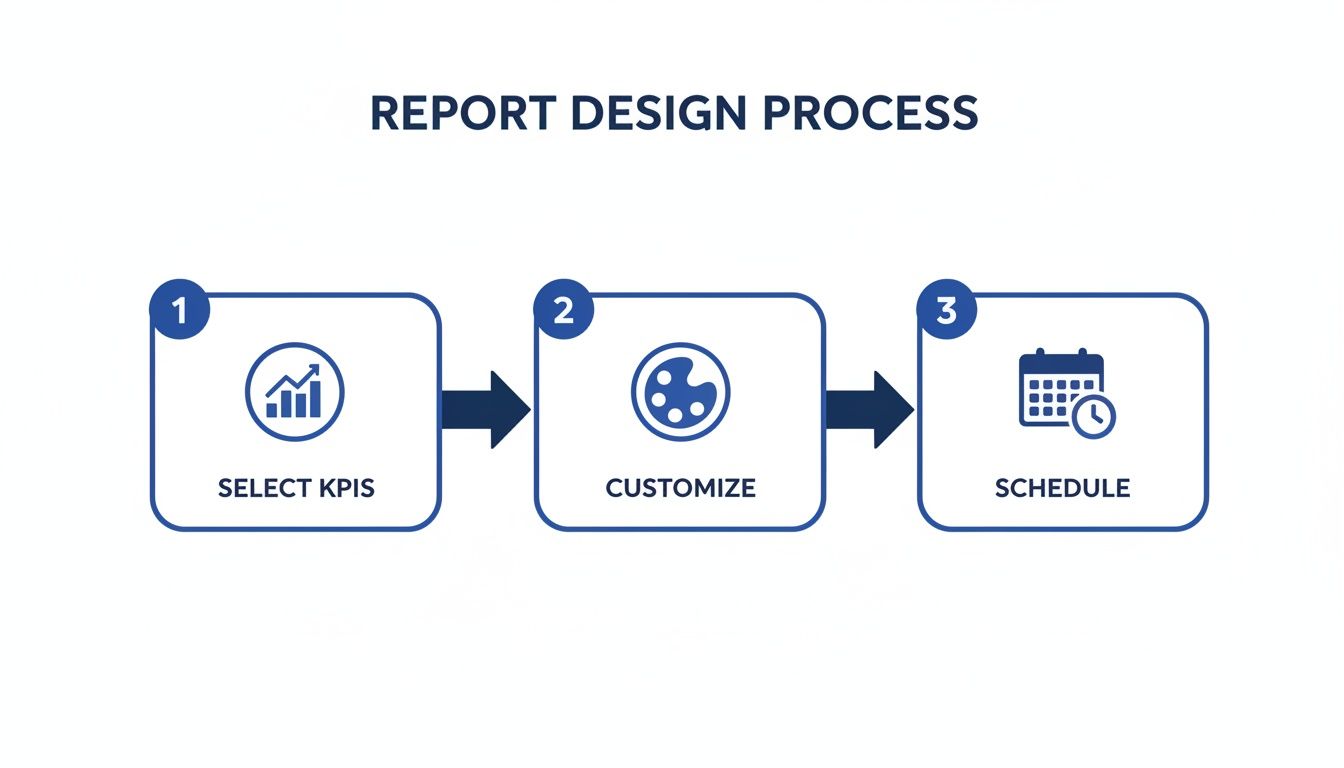
As you can see, building powerful reports is a straightforward flow, from deciding what to measure to scheduling when it lands in someone's inbox.
Common Data Sources to Connect
While you can connect just about anything with an API, most marketers start with a core set of platforms to get the most bang for their buck. These integrations provide a rock-solid foundation for any automated marketing report.
Here are the heavy hitters you'll want to connect first:
- Web Analytics (e.g., Google Analytics): This is the bedrock. It tells you who is visiting your site, where they came from, and what they do once they're there.
- Paid Advertising (e.g., Google Ads, Facebook Ads): To understand your return on ad spend, you absolutely have to pull in data on clicks, impressions, and conversions.
- SEO Tools (e.g., Google Search Console, Ahrefs): See which keywords are driving traffic, track your rankings, and monitor your site's overall health in the SERPs.
- E-commerce Platforms (e.g., Shopify, WooCommerce): For online stores, this is non-negotiable. Track revenue, average order value, and top-performing products right alongside your marketing metrics.
Connecting these sources transforms your reporting from a bunch of disjointed snapshots into a coherent movie. It’s the difference between seeing a single frame and understanding the entire plot. With everything in one place, you can finally make strategic decisions based on the full story.
Common Reporting Pitfalls and How to Avoid Them
So you’ve got your automated marketing reports up and running. You're probably feeling pretty good about yourself, picturing all the free time you’ve just unlocked. But hold on a second—just because the machine is humming doesn’t mean it’s spitting out gold.
Crafting a genuinely useful report means you have to dodge a few classic, facepalm-worthy mistakes. Think of this as your field guide to avoiding the traps that turn a beautiful report into a one-way ticket to your stakeholder’s trash folder.
The Siren Song of Vanity Metrics
First up is the most seductive trap of all: vanity metrics. These are the numbers that look amazing on the surface but tell you absolutely nothing about what’s actually driving the business. We’re talking about things like social media likes, raw impressions, or total website visits.
Sure, seeing a huge number of impressions feels good, but did it lead to a single sale? Probably not. Research from HubSpot shows that while 77% of marketers use social media analytics, many get stuck tracking numbers that don't connect to real business outcomes. Focusing on these is like bragging about how many people drove past your lemonade stand instead of how many actually bought a drink.
To sidestep this, tie every single metric you track back to a core business goal.
- Instead of Page Views, track the Conversion Rate on your most important landing pages.
- Instead of Email Open Rate, focus on the Click-Through Rate to your actual offer.
- Instead of Impressions, measure your Return on Ad Spend (ROAS).
This simple shift changes the entire conversation from "Look how popular we are!" to "Look how much revenue we're generating."
The "War and Peace" Report
Next up is the sin of information overload. Nobody—and I mean nobody—wants to open a 50-page report packed with every chart and graph known to humankind. It’s overwhelming, and it’s a surefire way to guarantee your report will go unread.
Your job isn't to be a data firehose; it's to be a filter. A good report should be a highlight reel, not the raw, unedited footage of your entire marketing operation.
The goal of an automated marketing report isn't to show everything you can measure, but to highlight the few things you must know to make better decisions.
Keep it short, sweet, and to the point. If a metric doesn't help the reader make a specific decision, cut it without mercy. A concise, focused report is a report that actually gets used.
The "Set It and Forget It" Ghost Ship
Perhaps the biggest danger of automation is treating it like a crockpot. You can't just set it and forget it. A report that runs on autopilot without any human oversight quickly becomes a ghost ship—drifting aimlessly and delivering outdated or irrelevant information.
Your marketing strategy changes, so your reports need to change, too. What was a critical KPI last quarter might be totally useless today.
Schedule a quarterly check-in to review your automated reports. Ask yourself:
- Are these KPIs still aligned with our current business goals?
- Is this report still relevant to the person receiving it?
- Is there a better way to visualize this data to make it clearer?
This regular maintenance ensures your automated system remains a powerful tool, not just a noisy robot spamming everyone's inbox. By steering clear of these common pitfalls, you can turn your automated marketing reports from a simple convenience into an indispensable strategic asset.
Choosing the Right Automated Reporting Tool
Alright, you’re sold. The spreadsheet black hole is officially on your eviction notice. But now you’re standing in the digital candy aisle, staring at a wall of shiny automated reporting tools. How do you pick the one that won’t give you a technical toothache?
Choosing the right platform is less about finding the one with the most buttons and more about finding the perfect partner for your team. It’s like hiring a new employee—you need someone who fits the culture, has the right skills, and doesn’t create more work than they solve. Let's break down what really matters.
Non-Negotiable Features to Look For
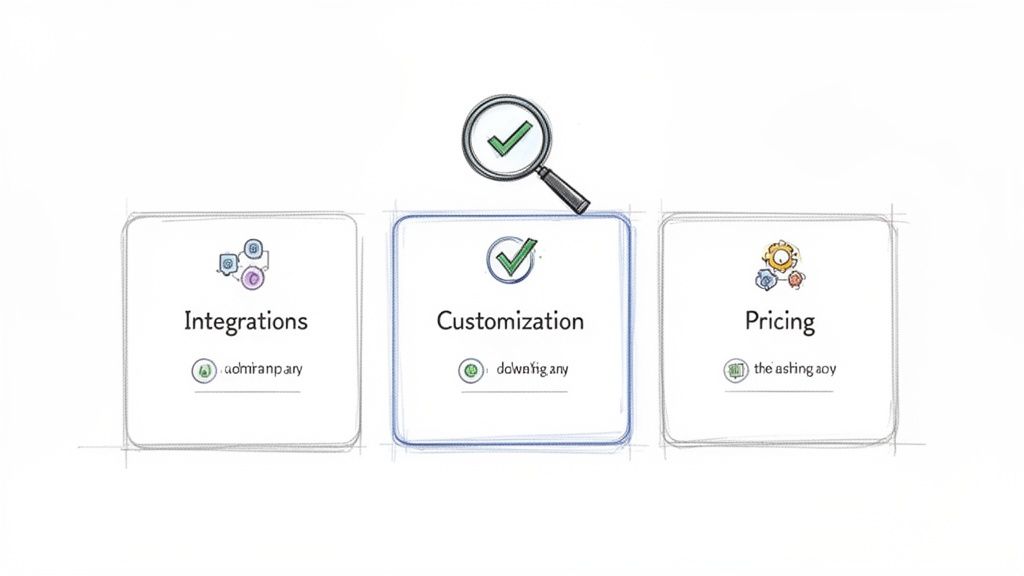
Not all tools are created equal. Some are like a Swiss Army knife with a million tiny, useless tools, while others are a perfectly sharpened chef's knife. To find your perfect match, you need a checklist of the absolute must-haves.
Here are the features that separate the contenders from the pretenders:
- Integrations Galore: Your tool is useless if it can't talk to the platforms you already use. Make sure it connects seamlessly with your core data sources like Google Analytics, social media ad platforms, and SEO tools.
- Deep Customization: Can you change more than just the logo? Look for a tool that lets you control the layout, add your own commentary, and select the exact KPIs you need for each audience.
- White-Labeling for Agencies: If you're an agency, this is non-negotiable. You need reports that look like they came from you, not a third-party tool. This reinforces your brand and makes you look like a total pro.
- Smart Alert Systems: The best tools don't just report the news; they break it. An alert system that notifies you of sudden data spikes or drops is a lifesaver, helping you catch problems before your client does.
Evaluating Usability and Pricing
Once you’ve got a shortlist of tools with the right features, it’s time for the final two tests: ease of use and price. A powerful tool that requires a PhD in computer science to operate is just another headache waiting to happen.
The goal is to empower your team, not create a new technical burden. Always take advantage of a free trial. If you can't figure out how to build a basic report in 15 minutes, run for the hills.
According to the 2024 State of Marketing AI Report, one of the biggest hurdles to full adoption is the lack of education and training. An intuitive, easy-to-use tool dramatically lowers this barrier.
Pricing models can also be tricky. Some platforms charge per user, others per report, and some have tiered feature sets. Do the math based on your specific needs—don't get dazzled by a low entry price only to find out it costs a fortune to add the one feature you actually need.
Choose a solution that scales with you, ensuring you don’t have to switch platforms a year from now. This isn't just about buying software; it's about finding your reporting soulmate.
Got Questions About Automated Reporting?
Still have a few things rattling around in your head? Good. Let's tackle the most common questions we hear about automated marketing reports. My goal here is to help you ditch the manual reporting misery and step into automated bliss with total confidence.
Is This Going to Replace My Job?
Short answer? Nope. But it will make you way better at it.
Think of automation as a promotion from "data janitor" to "strategic analyst." It takes over the soul-crushing, repetitive tasks that eat up your week, freeing you up for the fun stuff—like dreaming up brilliant campaigns and actually figuring out what the data means.
Gartner research predicts that by 2025, data storytelling will be the most widespread way of consuming analytics. Your job won't be taken by AI. It'll be taken by someone who knows how to use it to get better results.
How Hard Is It to Set Up?
Honestly, it’s easier than building IKEA furniture. Most modern platforms are built to be incredibly straightforward. You won't need to write a single line of code.
It’s usually a simple point-and-click affair:
- Connect your data sources (like Google Analytics or Facebook Ads).
- Pick a pre-built template or drag and drop the metrics you want.
- Set your schedule (say, every Monday at 9 AM).
You can have your first report up and running in less time than it takes to watch an episode of your favorite show.
The whole point of automation is to simplify your life, not give you another technical headache. If you can't build a basic report during a free trial in about 15 minutes, it's probably not the right tool for you.
What If I Need a Super Specific Metric?
Great question! While templates are a fantastic starting point, any tool worth its salt will let you get granular. Need to track conversions from a very specific campaign targeting a particular city? No problem.
The best platforms offer deep customization, letting you build reports around the exact KPIs that matter to your clients or your boss. This makes sure you're not stuck with generic, one-size-fits-all dashboards. Your reports should tell your story, and the right tool gives you the freedom to do just that. It's all about getting the data you need, exactly how you need it.
Ready to finally ditch the spreadsheets and get hours back in your week? MetricsWatch makes it ridiculously easy to create and schedule beautiful, insightful reports that prove your value. Start your free 14-day trial today and see for yourself!


