Build Better SEO Client Dashboards And Stop Wasting Time

If you've ever spent a late night squinting at a spreadsheet, manually copying and pasting data from five different tools just to build one client report, you know the pain. It’s a soul-crushing time sink that agencies everywhere are all too familiar with. So much fun, right?
This isn't just about saving your sanity, though. That whole outdated process is actively costing you business. Every hour your team spends wrangling data is an hour they aren't spending on strategy, optimization, or, you know, actually talking to clients.
The manual grind inevitably leads to inconsistent, error-prone reports that often confuse clients more than they clarify.
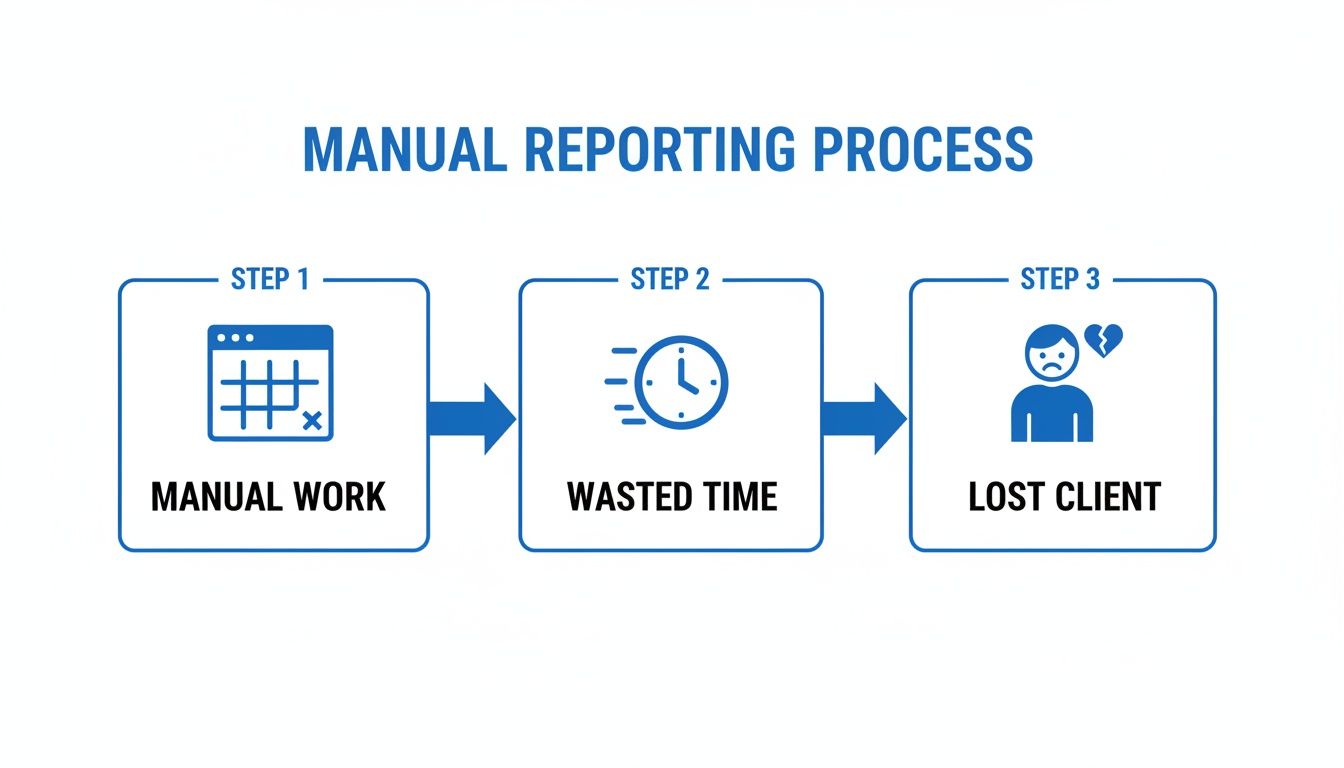
As you can see, it's a vicious cycle. The tedious work doesn't just waste time—it can lead directly to an unhappy, unconvinced client walking out the door. Poof. Gone.
The True Cost of Outdated Reporting
An automated SEO client dashboard flips this entire dynamic on its head. It’s not just a prettier way to show charts; it's a powerful client retention tool. A well-designed dashboard delivers undeniable proof of your value and becomes your best defense against scope creep and nervous questions.
Imagine this: a client calls in a panic about a sudden dip in traffic. Instead of scrambling to pull numbers and build a report from scratch, you pull up their live dashboard instantly. You can show them the context—maybe it’s a minor seasonal trend, not a catastrophe—and pivot the conversation to strategic next steps.
This shift from reactive damage control to proactive, data-driven conversation is what separates thriving agencies from struggling ones. It builds trust and reinforces your role as a strategic partner, not just a task-doer.
In the rapidly expanding SEO services market—which is projected to hit a whopping $83.98 billion globally in 2026—this kind of efficiency isn't a luxury; it's a necessity.
Agencies using automated reporting tools like MetricsWatch save countless hours of manual work. That's a critical advantage when you're competing in a market where Google handles over 8.5 billion daily searches, according to Internet Live Stats. You just can't afford to fall behind. You can explore more about these market trends and what they mean for your agency's future.
Choosing KPIs That Actually Matter To Your Clients
Let's be real for a second. The moment you show a client a wall of numbers, their eyes glaze over. Drowning them in every metric you can pull is the fastest way to get your reports ignored and sent straight to the trash folder.
A great SEO client dashboard tells a story. You get to pick the main characters—your Key Performance Indicators (KPIs). The real goal isn't to show everything, it's to show what matters. It all boils down to connecting your SEO work directly to their bottom line. The secret? Stop thinking like an SEO and start thinking like their business partner.
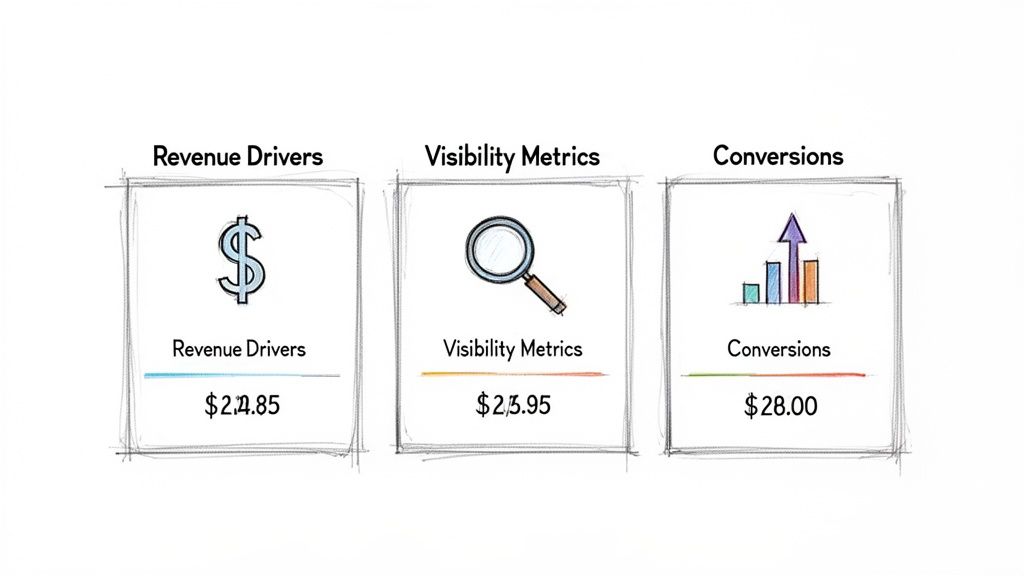
The Great KPI Divide: Revenue vs. Visibility
Not all metrics are created equal, especially in your client's mind. The trick to building a dashboard they'll actually read is to group your KPIs into two simple, powerful categories. This approach tells a complete and compelling performance story at a glance.
Revenue Drivers
These are the bottom-line metrics that get you paid and keep clients happy. They cut through the noise and answer the only question that truly matters to them: "Is this SEO thing making us money?"
- Goal Completions: Think lead form submissions, newsletter sign-ups, or guide downloads. This is tangible proof that people are taking the desired action.
- Organic-Driven Revenue: For any e-commerce client, this is the holy grail. It shows the exact dollar amount generated from your organic search efforts. No fluff, just impact.
- Conversion Rate: This is the percentage of visitors who take that valuable action. A rising conversion rate means the traffic you're driving is getting more and more valuable. According to research from Unbounce, the average landing page conversion rate is around 9.7%, so even small improvements are a huge win.
Visibility Metrics
These are the leading indicators. They show how you're generating those revenue results and answer the client's next logical question: "Are more of the right people finding us online?"
- Organic Traffic: This is the foundation of it all—the total number of visitors arriving from search engines. More relevant traffic equals more opportunities.
- Keyword Rankings: Tracking your position for high-intent keywords shows you're capturing valuable search real estate. When you consider that hitting the top spot on Google can earn a massive 39.8% click-through rate, as reported by FirstPageSage, this metric carries serious weight.
- Click-Through Rate (CTR): A high CTR means your page titles and meta descriptions are compelling enough to win the click over your competitors. It's the first battle you have to win in the SERPs.
By separating your KPIs this way, you make the dashboard instantly easier to digest. The client sees the "what" (revenue) and the "how" (visibility) in a single view, turning a confusing data dump into a clear, actionable progress report.
To help you frame this conversation, here's a quick reference table that matches common client goals with the KPIs that speak their language.
Matching SEO KPIs to Client Business Goals
| Client Business Goal | Primary SEO KPIs | Why It Matters to Them |
|---|---|---|
| Increase Sales/Revenue | Organic-Driven Revenue, Goal Completions, Conversion Rate | This directly shows the ROI of your SEO services in dollars and cents. |
| Generate More Leads | Form Submissions, Phone Calls, Organic Traffic | Measures the volume of new business opportunities your work is creating. |
| Build Brand Awareness | Organic Traffic, Keyword Rankings, Branded Search Volume | Demonstrates growing visibility and recognition in their target market. |
| Outrank Competitors | Keyword Rankings, Share of Voice, Backlink Growth | Shows tangible progress in dominating the search landscape against key rivals. |
| Become a Thought Leader | Top-of-Funnel Keyword Rankings, Organic Traffic to Blog | Proves that your content strategy is attracting and engaging their ideal audience. |
This isn't just about picking metrics; it's about building a shared language of success with your client from the very beginning.
It All Starts With "The KPI Talk"
The most effective dashboards I've ever built were born from a simple conversation. Before you even think about connecting data sources, you need to have "The KPI Talk" with your client.
Ask them one simple question: "A year from now, what result would make you feel like this investment was a massive success?"
Their answer is your roadmap. If they say, "I just need the phone to ring more," then your dashboard's hero metrics are form submissions and click-to-call events. If they say, "We need to beat Competitor X," then keyword ranking reports and share of voice are your north stars.
This initial alignment is everything. It guarantees your SEO client dashboard is built around their definition of success from day one. This conversation transforms you from a vendor they hired into a strategic partner who is genuinely invested in their growth. And that's a relationship that lasts.
Connecting Data Sources Without The Headache
Alright, you and your client have nailed down the perfect KPIs. Now for the part that sounds way more technical than it actually is: getting all that data to play nicely together in one dashboard.
Good news. You don't need to be a developer to build a powerful SEO client dashboard. You just need to know where to plug things in.
Think of it like this: relying on just one data source is like trying to understand a movie by only listening to the audio. You get some of the story, but you're missing the whole picture. This is where most agencies get stuck, manually patching together spreadsheets and screenshots. Yikes.
To really get ahead, you need to focus on Automated Data Integration. It’s the difference between trying to assemble a car from scratch and just turning the key.
The Essential Data Trio
To build a dashboard that tells a complete and compelling story, you need to connect three core tools. Each one gives you a unique and absolutely vital piece of the puzzle.
Here’s the breakdown:
Google Analytics (The Behavior Expert): This is all about what people do once they land on your client's site. How long do they stay? Which pages do they check out? And the big one—are they converting? It’s your go-to for measuring user engagement and proving that your work is making them money.
Google Search Console (The Visibility Guru): Think of this as your direct line to Google. It shows you what happens before someone even clicks, like which search queries bring up the site, how many people see it (impressions), and what the click-through rate is. It’s pure, unfiltered organic performance data.
A Rank Tracker (The Competitive Scout): This is your eye on the competition. It shows you exactly where your client stands in the search results for the keywords that matter most. It adds that critical competitive context that the other two tools just can't provide, showing progress against rivals and uncovering new ranking opportunities.
Without all three, you’re flying blind. Analytics without Search Console tells you nothing about your organic visibility. Search Console without a rank tracker misses the competitive landscape. You need them all working together.
Avoiding Common Connection Catastrophes
Connecting these sources to a platform like MetricsWatch is usually just a few clicks. But I've seen a couple of classic blunders trip people up and lead to some pretty awkward client conversations.
For instance, with Google holding over 90% of the search market share (Statcounter) and rolling out hundreds of algorithm updates a year, having integrated data isn't just a "nice-to-have"—it's non-negotiable. And since 46% of all searches have local intent, according to HubSpot, connecting location-specific data from Google Business Profile is a game-changer for many clients. If your data sources aren't synced up, you miss these massive insights.
A major pitfall I see all the time is misconfigured goals in Google Analytics. If a "lead" isn't being tracked correctly on their end, your dashboard will show zero conversions even if the client's phone is ringing off the hook.
Always, always double-check that your goals are firing correctly before you connect the data. It's a five-minute check that can save you from a world of reporting pain.
And for those who need to pull in data from more niche or proprietary tools, you can explore more advanced options. We've put together a guide on how to set up custom API connections for analytics for when you need to get really specific.
Designing A Dashboard Your Clients Will Actually Read
An ugly, confusing dashboard is just as bad as that messy spreadsheet you’re trying to escape. Let’s face it, if a client needs a decoder ring to understand your report, they’re not going to read it. The goal is to create something they’re actually excited to open and can understand in under five minutes.
Good design isn't just about making things look pretty; it's about making data intuitive. This starts with a simple, powerful trick: white-labeling. Using your client's logo and brand colors makes the dashboard feel like a natural part of their own business toolkit, not some generic report you slapped together.
This small touch builds instant familiarity and reinforces that you're an integrated part of their team. It's a nice little ego boost for them, too.
Start With The Big Stuff First
People read top-to-bottom, left-to-right. So, put the most important, bottom-line numbers right at the top where they can't be missed. Think of it as the "Don't Make Me Think" approach to data.
This is where you use scorecards—big, bold numbers that scream "Here's what you paid for!" These should highlight the top-level KPIs we talked about earlier, like total organic traffic, goal completions, and maybe even a dollar value for organic-driven revenue.
This simple layout answers their biggest questions before they even have to ask. It immediately shows the value you're providing, setting a positive tone for the rest of the report.
Here’s an example of a clean, easy-to-read dashboard layout that puts key metrics front and center.
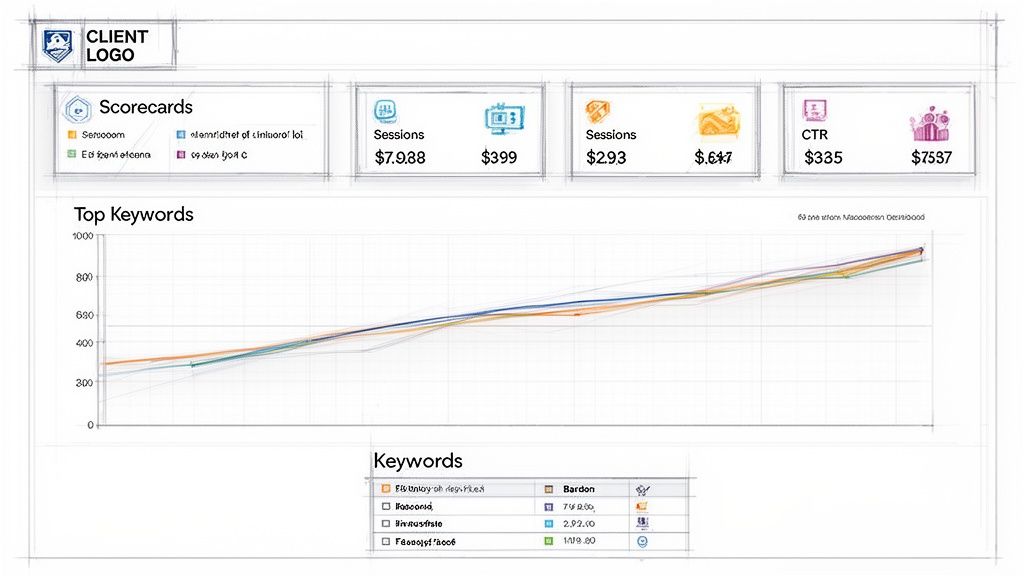
Notice how the scorecards at the top give an instant snapshot of performance, while the graphs below provide deeper context.
Choose The Right Visual For The Job
Once you've established the high-level summary, you can add more detailed visualizations that tell the rest of the story. But don't just throw charts at the wall and see what sticks. Different data needs different visuals.
- Trend Lines: Perfect for showing performance over time. A simple line graph is the best way to visualize organic traffic growth over the last six months or track keyword ranking improvements.
- Simple Tables: Don't underestimate the power of a clean table. Use it to show keyword movements—new rankings, lost positions, and top performers. Keep it focused on the most important terms.
- Pie Charts or Bar Graphs: Use these to break down traffic sources (e.g., Organic vs. Direct vs. Referral) or show the percentage of traffic landing on top pages.
The key is to avoid complexity. A report filled with cluttered, multi-axis charts is a report that gets ignored. Every single chart or table in your SEO client dashboard should answer a specific question clearly and quickly.
Remember, a great dashboard design guides your client through the data, telling a story of progress and value. If you're looking for more inspiration, you can find a ton of tips on how to design user-friendly dashboard interfaces that keep clients engaged and informed. Your goal is to make your reporting the most anticipated email they get all month.
Putting Your Reporting On Autopilot
You’ve built the perfect, beautiful, white-labeled dashboard. High five! Now, let's make sure you never have to manually send a PDF report at 11 PM ever again.
This is where your SEO client dashboard stops being just a reporting tool and starts being a time-saving machine that reclaims your weekends. The whole point is to set it and forget it.
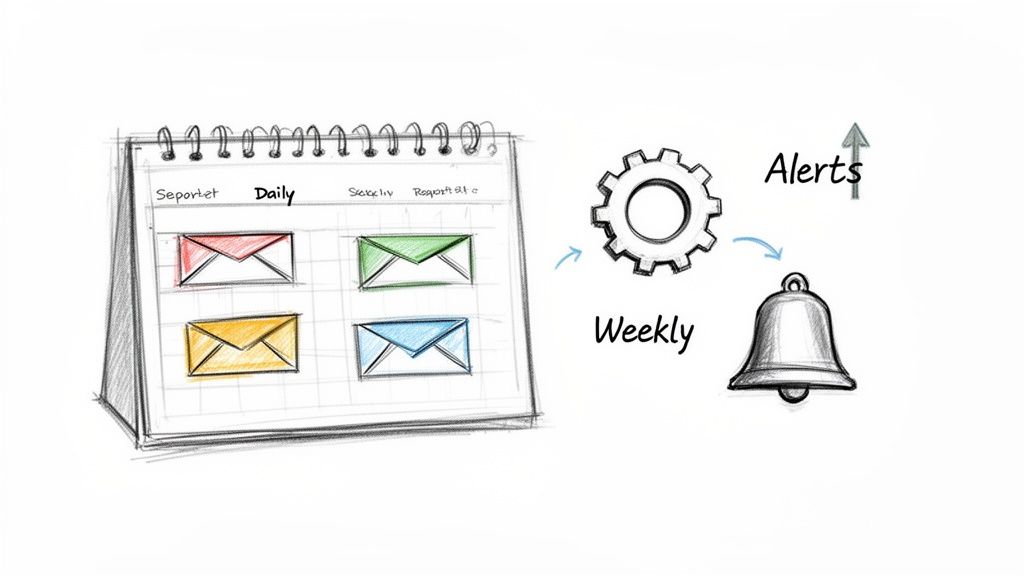
You can schedule reports to land in your client's inbox at the exact same time every day, week, or month. That kind of consistency is a massive trust signal, and automation makes you look incredibly professional without lifting a finger.
Go Beyond Basic Scheduling
Setting a schedule is step one, but the real magic comes from proactive monitoring. This is where you graduate from being a reactive report-sender to a proactive, problem-solving hero.
The secret weapon? Smart alerts.
Think about it. Waiting until the end of the month to discover that your client’s organic traffic fell off a cliff is an absolute nightmare. By then, the damage is done, and you’re left scrambling to explain what went wrong.
Smart alerts flip the script entirely. Instead of you finding problems, the problems find you—instantly. This lets you fix issues before the client even knows they exist.
Tools like MetricsWatch allow you to set up custom alerts for just about any metric you can imagine. This isn't just a "nice-to-have" feature; it's a critical safety net for your client relationships.
Alerts That Save the Day
So, what exactly should you be watching? Here are a few game-changing alerts that can make you look like an SEO psychic:
- Sudden Traffic Drop: Get an immediate heads-up if organic traffic plummets by more than 20% day-over-day. This could signal a technical hiccup, a manual penalty, or a botched algorithm update.
- Conversion Rate Crash: If your client’s e-commerce conversion rate suddenly tanks, you need to know now. An alert can tell you within minutes if a broken checkout button is costing them thousands.
- Spike in 404 Errors: A sudden jump in "Page Not Found" errors, easily visible in Google Search Console, means users are hitting dead ends. An alert lets you jump on redirecting those broken links immediately.
- Major Keyword Ranking Loss: Did your client's most important money-making keyword just fall off page one? An instant alert means you can start digging into the cause right away, not weeks later.
Setting up these automated checks is the difference between good client service and a truly exceptional, proactive partnership. Research from Bain & Company shows that increasing customer retention by just 5% can boost profits by 25% to 95%.
Automated reporting and alerts ensure you're always on top of the data and constantly communicating value. It turns your SEO client dashboard into your single best client retention tool.
Answering Your Burning Questions About SEO Dashboards
You’ve got questions, I’ve got answers. Over the years, I've heard just about every query imaginable from agencies making the leap into automated reporting. Let’s cut through the jargon and get right to the practical stuff you can use today.
What's an SEO Dashboard, Anyway?
An SEO client dashboard is a live, interactive hub that pulls all your key performance data together in real time. Think of it as your single source of truth—the command center for your campaign.
A report, on the other hand, is just a static snapshot. It's that PDF you email over at the end of the month to show what happened. One is a living, breathing tool; the other is a historical document.
What Should Actually Go Into a Dashboard?
The best dashboards tell a clear story. Don't just cram every metric you can find into one screen. That’s a surefire way to overwhelm a client. Instead, focus on the metrics that show real progress.
I always recommend starting with the essentials:
- Visibility Metrics: How are we showing up in search? This is where you track things like keyword rankings, organic traffic, and impressions from Google Search Console.
- Engagement Metrics: Are people actually sticking around once they click? Here you’ll want to look at click-through rates, time on page, and bounce rate from Google Analytics.
- Conversion Metrics: The big one—is all this effort actually making money? Track goal completions, organic-driven revenue, and conversion rates. This is where you prove your worth.
Remember, a great dashboard has to align with your client's business goals. If they live and die by lead generation, make sure those metrics are front and center. It's all about showing them the data they truly care about, not just everything you can track.
Is This Any Different From a General Marketing Dashboard?
Absolutely. A general marketing dashboard is more like a variety platter. It pulls a little bit of data from everywhere—social media, PPC, email, and SEO—to give a broad overview of the entire marketing mix.
An SEO client dashboard is a deep dive. It’s laser-focused on the nitty-gritty details that matter for organic search performance. We’re talking about your backlink profile, technical site health, and the movement of specific, high-intent keywords.
The real power of a dedicated dashboard is connecting the dots. It’s about showing a client how fixing that one technical issue led to better rankings, which drove more traffic, and ultimately, resulted in more sales for their business.
This focused view is critical for proving your value. Agencies that can clearly demonstrate ROI are the ones that keep clients for the long haul. When you consider that research from Deloitte found that customer-centric companies were 60% more profitable compared to companies that were not, clear reporting becomes one of your most powerful retention tools.
By showing consistent progress and sharing proactive insights, you build trust and make your services impossible to replace.
Ready to stop building reports and start delivering real-time insights? MetricsWatch helps you create beautiful, automated SEO client dashboards that your clients will actually love. Start your free trial today and see just how easy it is to put your reporting on autopilot.


