The 12 Best Website Performance Monitoring Tools of 2026 (For Real People)

Let's be real: a slow website is a digital ghost town. A tiny one-second delay can slash conversions by 7%, according to research from Portent. Yikes. Even worse, if your site takes more than three seconds to load, a whopping 53% of your mobile visitors will just leave, according to Google. You work way too hard driving traffic to your site just to have it vanish into thin air because of a sluggish server or a bloated script.
This is where website performance monitoring tools come to the rescue. Think of them as your 24/7 digital watchdogs, constantly checking your site's speed, availability, and overall user experience. They sniff out slow pages, broken links, and full-on outages before your customers (or, more importantly, your boss) even notice. This means you can fix problems like a ninja instead of reacting to angry emails. To truly get ahead, a smart approach that blends Performance Monitoring and Website Optimization is key to turning performance data into actual improvements.
In this guide, we're cutting through the noise and jargon to show you the 12 best tools that actually get the job done. We'll dive into everything from simple uptime checkers to full-blown observability platforms that can diagnose the most complex performance bottlenecks. We’ll cover key features, who each tool is best for, and a realistic look at pricing, pros, and cons. No fluff, just the good stuff you need to find the perfect monitoring solution, keep your site fast, and stop leaving money on the table.
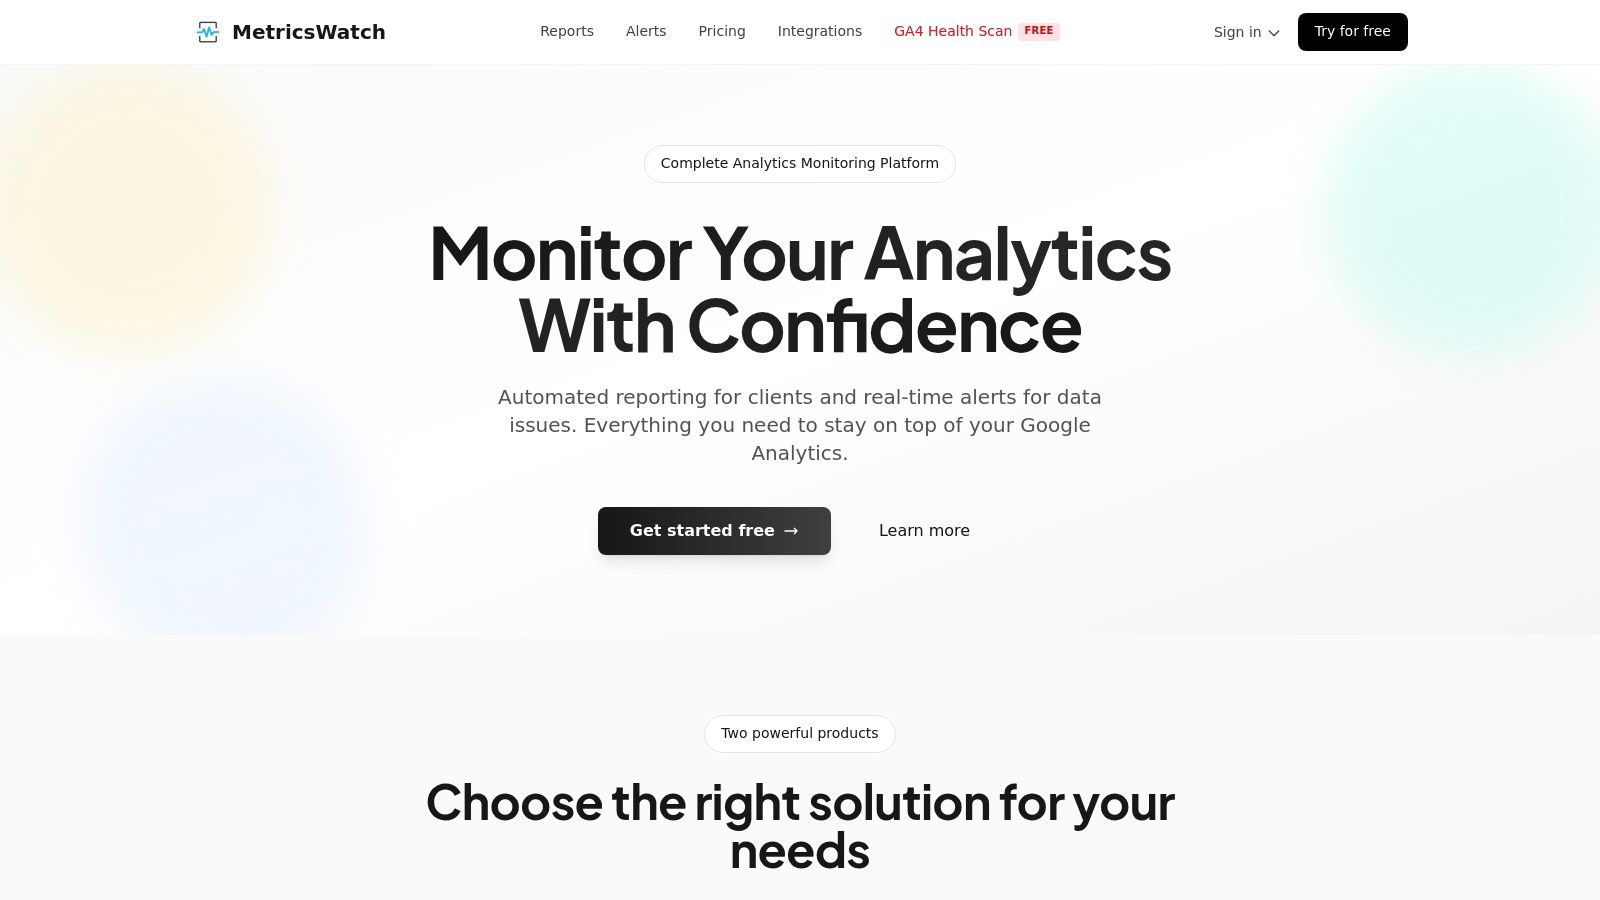
1. MetricsWatch
MetricsWatch is a different beast in the world of website performance monitoring tools. Instead of just checking if your site is online, it checks if your data is sane. It zeroes in on the integrity of your marketing data, especially from Google Analytics. This makes it a lifesaver for marketing agencies and e-commerce managers whose decisions depend on accurate analytics.
The platform is built to solve two huge headaches: the soul-crushing chore of manual reporting and the blind spots created by broken tracking. It tackles these with two main tricks: automated email Reports and real-time Alerts. It's like a safety net for your most important marketing numbers.
Key Features & Use Cases
MetricsWatch is all about automating the boring stuff and giving you a heads-up, so your team can move faster without worrying if the data is junk.
- Automated, White-Label Reporting: Agencies can save a ton of time by automating client reports. It pulls data from Google Analytics, Google Ads, Facebook Ads, and more into a single, slick-looking email report. No more spreadsheet nightmares.
- Real-Time Anomaly Detection: Get an email or Slack ping the moment a key metric suddenly tanks or goes to the moon. MetricsWatch claims it can spot big anomalies in about 10 minutes, so you can fix things before they hurt your wallet. A sudden drop in GA4 conversions could mean your checkout button is busted, and this tool helps you catch it fast.
- GA4 Health Scan: A brilliant, totally free feature. The scan peeks at 90 days of your Google Analytics data in under a minute to find old tracking gaps you might have missed. It’s a great way to check a new client's setup or just make sure your own tracking isn't held together with duct tape.
Pricing
MetricsWatch has a simple pricing structure and a free trial that doesn't ask for your credit card. Phew.
| Product | Starting Price | Key Inclusions |
|---|---|---|
| Reports | $49/month | Up to 2 reports |
| Alerts | $99/month | Up to 3 alerts |
Pros & Cons
| Pros | Cons |
|---|---|
| Saves Hours on Reporting: Automates and white-labels client reports. | Lack of Social Proof: Hard to find customer testimonials or case studies. |
| Fast, Low-Noise Alerts: Detects anomalies in ~10 minutes with a claimed zero false-positive rate. | Unclear Enterprise Pricing: Pricing for big teams is a mystery. |
| Extremely User-Friendly: Alerts take 5 minutes to set up, and the GA4 Health Scan is instant. | |
| Low-Friction Trial: A no-credit-card free trial makes trying it out a breeze. |
Website: https://metricswatch.com
2. SolarWinds Pingdom
SolarWinds Pingdom is basically the OG of website performance monitoring tools, hitting that perfect sweet spot between powerful features and being super easy to use. It’s for teams who need to know right now if their site is slow or down without needing a Ph.D. in server infrastructure. Pingdom mixes synthetic monitoring (bots checking your site from all over the world) with Real User Monitoring (RUM) to see what actual humans are experiencing.
What makes Pingdom a fan favorite, especially for marketing folks, is how simple it is. You can set up an uptime check in minutes and get alerts via SMS or Slack. The reports are clean, pretty, and easy to share with people who don't speak "dev ops." This clarity is gold when you're trying to explain how page load times are affecting important web analytics metrics.
Key Features & Use Cases
- Best For: Marketing teams, e-commerce managers, and small businesses who care more about uptime and what users see than deep-dive server diagnostics.
- Synthetic Monitoring: Automate checks for uptime, page speed, and important user journeys like logging in or adding to a cart from over 100 locations.
- Real User Monitoring (RUM): Get the real scoop on how users with different browsers, devices, and countries are actually experiencing your site.
- Public Status Pages: Easily whip up a branded status page to tell users about downtime, building trust instead of causing panic.
Pricing & Implementation
Pingdom's pricing is a bit like a build-your-own-burger menu. You use a configurator to pick how many uptime checks, RUM pageviews, and advanced checks you need. It starts around $15/month for a basic setup. Getting started is famously easy; for basic uptime, you just plug in your URL.
| Pros | Cons |
|---|---|
| Very easy to set up and understand the data. | Pricing configurator can feel less clear than simple tiers. |
| Flexible mix of synthetic and RUM monitoring. | Lacks the super-deep, full-stack context of bigger platforms. |
| Clean, shareable reports perfect for non-techy teams. | Can get pricey as you add more checks and RUM capacity. |
| Unlimited users included in paid plans. |
Website: https://www.pingdom.com
3. Datadog Synthetic Monitoring
Datadog Synthetic Monitoring is for teams who see website performance as one piece of a giant, interconnected puzzle. It goes way beyond simple uptime checks by plugging proactive tests into Datadog's massive ecosystem of logs, infrastructure monitoring, and APM. This tool is built for engineers and DevOps pros who need to simulate user journeys and then immediately dive into backend logs to find out why things are slow.
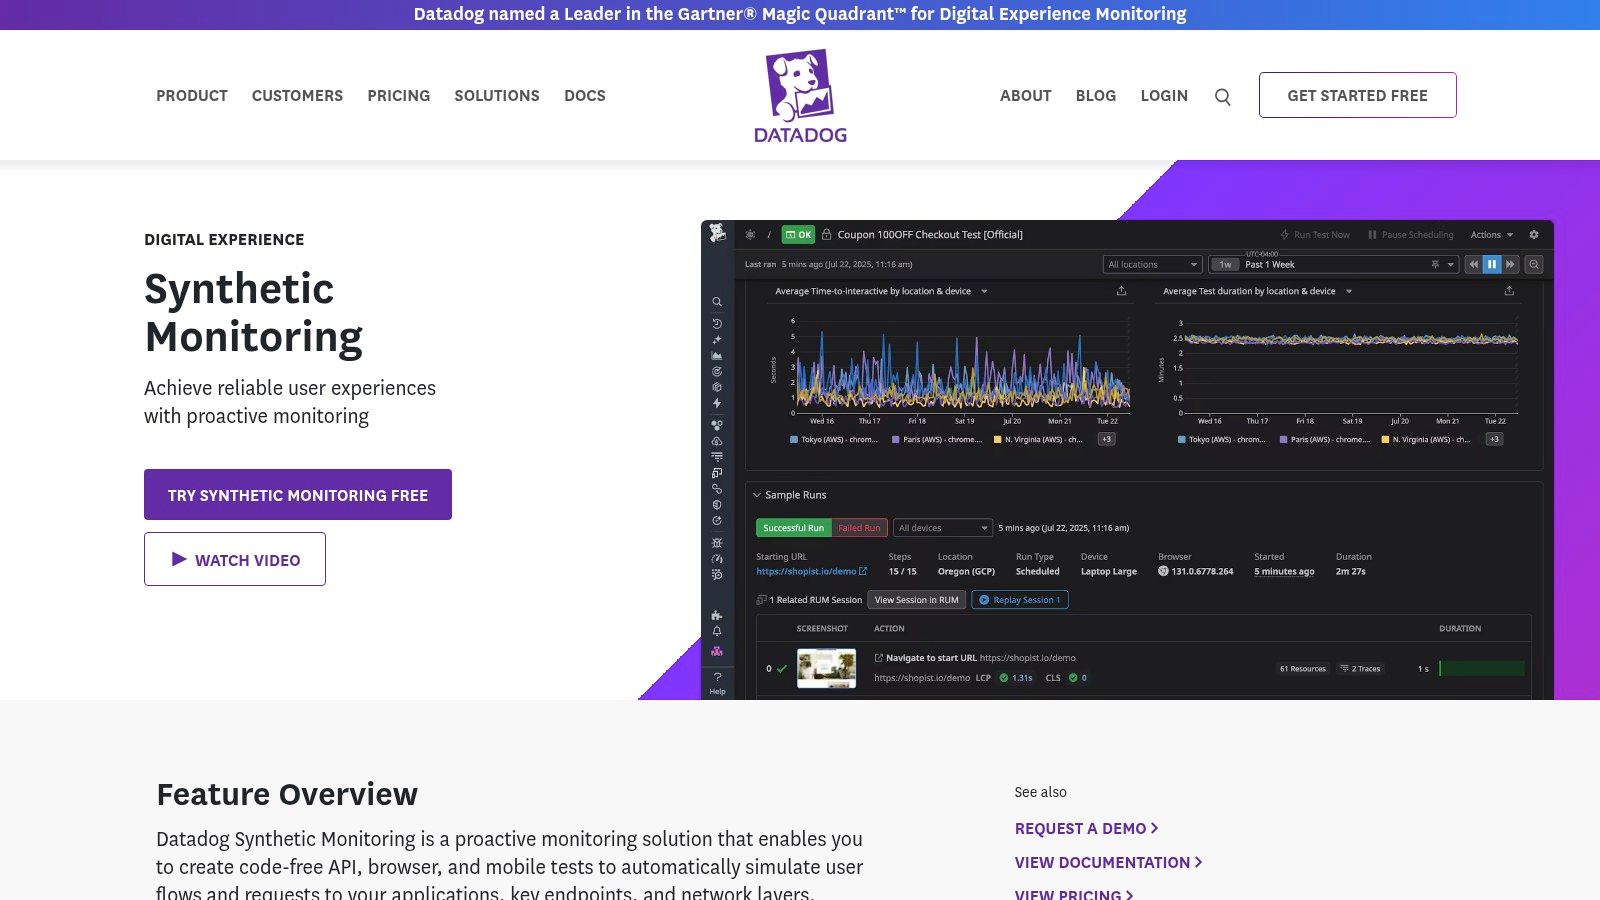
What makes Datadog special is its all-in-one platform vibe. An alert from a synthetic test isn't just a notification; it's the start of an investigation, all in one place. You can see how a slow API response lines up with a database query or a CPU spike without juggling a dozen different tools. This complete view helps connect performance problems directly to the code and servers causing them, which is vital for understanding how they affect key web analytics metrics.
Key Features & Use Cases
- Best For: DevOps and engineering teams, SREs, and companies already using Datadog who need the full story behind performance issues.
- Code-Free Browser & API Tests: Create multi-step user simulations (like login and checkout) without writing any code, and check critical API endpoints from all over the world.
- Unified Platform: Connect synthetic test results directly with RUM, logs, APM traces, and server metrics for super-fast, context-rich troubleshooting.
- CI/CD Integration: Automatically run performance tests in your development pipeline to catch problems before they ever make it to your live site.
Pricing & Implementation
Datadog's pricing is usage-based. Synthetic API tests start at $7 for 10,000 runs a month, and browser tests start at $18 for 1,000 runs a month. This is flexible, but costs can sneak up on you if you're not careful. Setting up basic tests is easy, but you'll need some expertise to unlock the platform's full detective power.
| Pros | Cons |
|---|---|
| Unmatched full-stack visibility in a single platform. | The platform is so big it can have a serious learning curve. |
| Tight integration with logs, APM, and server metrics. | Usage-based pricing can get expensive without careful management. |
| Powerful CI/CD testing to catch issues early. | Can be overkill for teams who just need simple uptime monitoring. |
| Huge library of third-party integrations. |
Website: https://www.datadoghq.com/synthetics/
4. New Relic (Synthetics + Web Performance Monitoring)
New Relic is an enterprise-level observability platform that also handles website performance monitoring with its Synthetics product. It’s designed for teams who already use New Relic for other things and want to keep all their tools in one place, or for anyone who loves a generous free tier. It offers a solid set of synthetic checks, covering uptime, SSL, and broken links along with key user experience metrics.
What makes New Relic stand out here is its pay-as-you-go model and how it fits simple web checks into a much bigger data platform. You get a boatload of free checks every month, and the price for going over is low and clear. This makes it a cheap and cheerful choice for teams that need reliable, no-frills synthetic monitoring without signing up for a huge subscription, especially if their needs change from month to month.
Key Features & Use Cases
- Best For: Dev and Ops teams already in the New Relic world, or businesses looking for a powerful free option for essential synthetic checks.
- Unified Observability: Combines website checks with a full suite of APM, RUM, infrastructure, and log tools for a complete performance picture.
- Core Vitals & Link Checking: Automate monitoring for uptime, SSL certificate health, broken links, and Core Web Vitals from 12 public locations. For a deeper look, you can learn how to automate Core Web Vitals reporting.
- Generous Free Tier: Comes with a huge number of free checks, making it super accessible for startups and small projects.
Pricing & Implementation
New Relic’s pricing is usage-based. The platform includes a lot of free checks (for example, the Standard plan gets 10,000 checks/month). If you go over, the extra cost is a transparent and tiny $0.005 per check. Setup means finding your way around the big New Relic platform, which can be a bit much, but creating a basic synthetic check is pretty simple.
| Pros | Cons |
|---|---|
| Large free allocation of checks available on paid plans. | Can be complex for users who just want simple uptime monitoring. |
| Part of a comprehensive observability platform. | Advanced features might need extra, complicated setup. |
| Transparent and low-cost overage pricing. | Private monitoring locations aren't included in this specific plan. |
| Integrates seamlessly with other New Relic products. |
Website: https://newrelic.com/platform/web-performance-monitoring
5. Dynatrace (Digital Experience Monitoring)
Dynatrace goes way beyond simple checks and into the world of enterprise-grade observability, making it one of the most powerful website performance monitoring tools for complicated digital setups. Its superpower is connecting the frontend user experience directly to the backend servers, using an AI engine named Davis to automatically find the root cause of problems. Dynatrace mixes Real User Monitoring (RUM) and synthetic monitoring to give you the full story, from a single user’s click to the exact database query that slowed them down.
What makes Dynatrace different is its Smartscape topology, which maps out your entire application environment in real-time. This means when a performance issue pops up, the platform doesn't just send an alert; it gives you the full context, showing you exactly how the problem is affecting user journeys and business goals. This end-to-end view is priceless for big companies where a tiny slowdown can mean big money lost.
Key Features & Use Cases
- Best For: Large enterprises, DevOps teams, and businesses with complex apps that need deep, AI-powered root-cause analysis.
- Real User Monitoring (RUM): Capture every user journey with optional session replay to see exactly what your customers see, including errors and "rage clicks."
- Synthetic Monitoring: Proactively monitor critical business transactions, APIs, and site availability from global locations on real browsers.
- AI-Assisted Analysis: The Davis AI engine automatically sifts through billions of data points to give you precise, actionable answers instead of just more charts.
Pricing & Implementation
Dynatrace uses a detailed, consumption-based pricing model. You pay for what you use, with clear prices for RUM sessions, synthetic requests, and other actions. While this is flexible, it means you have to be a good guesser to budget accurately. Setup is more involved than simpler tools, usually requiring you to install an agent for full visibility.
| Pros | Cons |
|---|---|
| All-in-one observability with deep, full-stack context. | Can be overkill and complex for simple uptime monitoring needs. |
| Powerful AI-driven root-cause analysis saves time. | Pricing model requires you to estimate your usage to budget. |
| Highly scalable for enterprise-level traffic and complexity. | Steeper learning curve compared to more focused tools. |
| Clear, granular unit pricing for actions and requests. |
Website: https://www.dynatrace.com/pricing/
6. Catchpoint
Catchpoint is an enterprise-level internet performance monitoring platform for businesses where even a tiny drop in performance can have huge financial consequences. It goes far beyond simple uptime checks, offering a deep look into the entire internet stack, including DNS, CDN, BGP, and network paths. If your business lives and dies by internet performance, Catchpoint gives you the data you need to stay resilient.
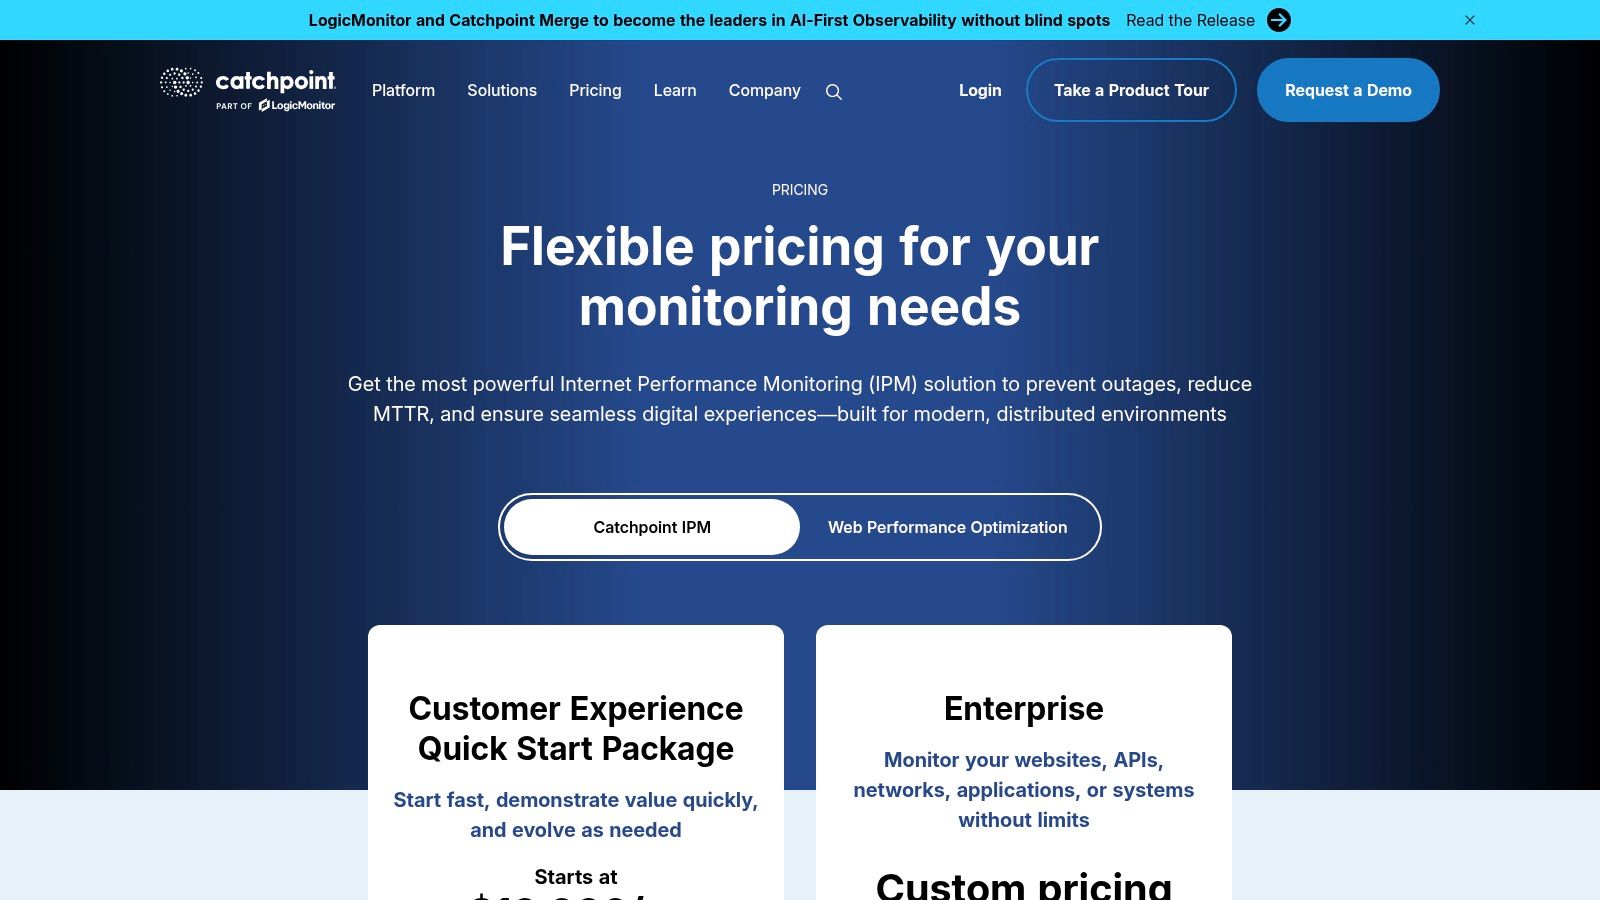
What makes Catchpoint different is its gigantic global monitoring network, with over 3,000 vantage points that help find region-specific issues others might miss. This platform is built for global companies that need to understand how the internet itself, not just their own code, is impacting the user experience. It's one of the most powerful website performance monitoring tools for figuring out complex problems involving third-party services.
Key Features & Use Cases
- Best For: Global enterprises, financial services, and large e-commerce sites that need to monitor the whole internet delivery chain, not just their website.
- Internet Stack Monitoring: Get visibility into performance across DNS, BGP, CDN, and third-party APIs to find root causes outside your own servers.
- Expansive Global Network: Use one of the industry's largest synthetic monitoring networks to accurately measure performance from your users' perspectives all over the world.
- AI-Guided Optimization: Use AI-driven suggestions and detailed waterfall charts with filmstrip screenshots to quickly diagnose and fix performance problems.
Pricing & Implementation
Catchpoint's pricing is customized for enterprise needs and isn't public. You'll need to talk to their sales team for a quote. Setup is more involved than with simpler tools and often needs dedicated team members, but Catchpoint has strong customer support to help you get started.
| Pros | Cons |
|---|---|
| Deep internet-layer monitoring finds issues beyond your app. | Higher entry price than tools aimed at smaller businesses. |
| Unparalleled global testing network provides granular location data. | Its complexity can require a dedicated person to manage it. |
| Strong enterprise onboarding and customer success support. | Might be overkill for teams focused only on application performance. |
| Unlimited users are included in higher-tier plans. |
Website: https://www.catchpoint.com/pricing
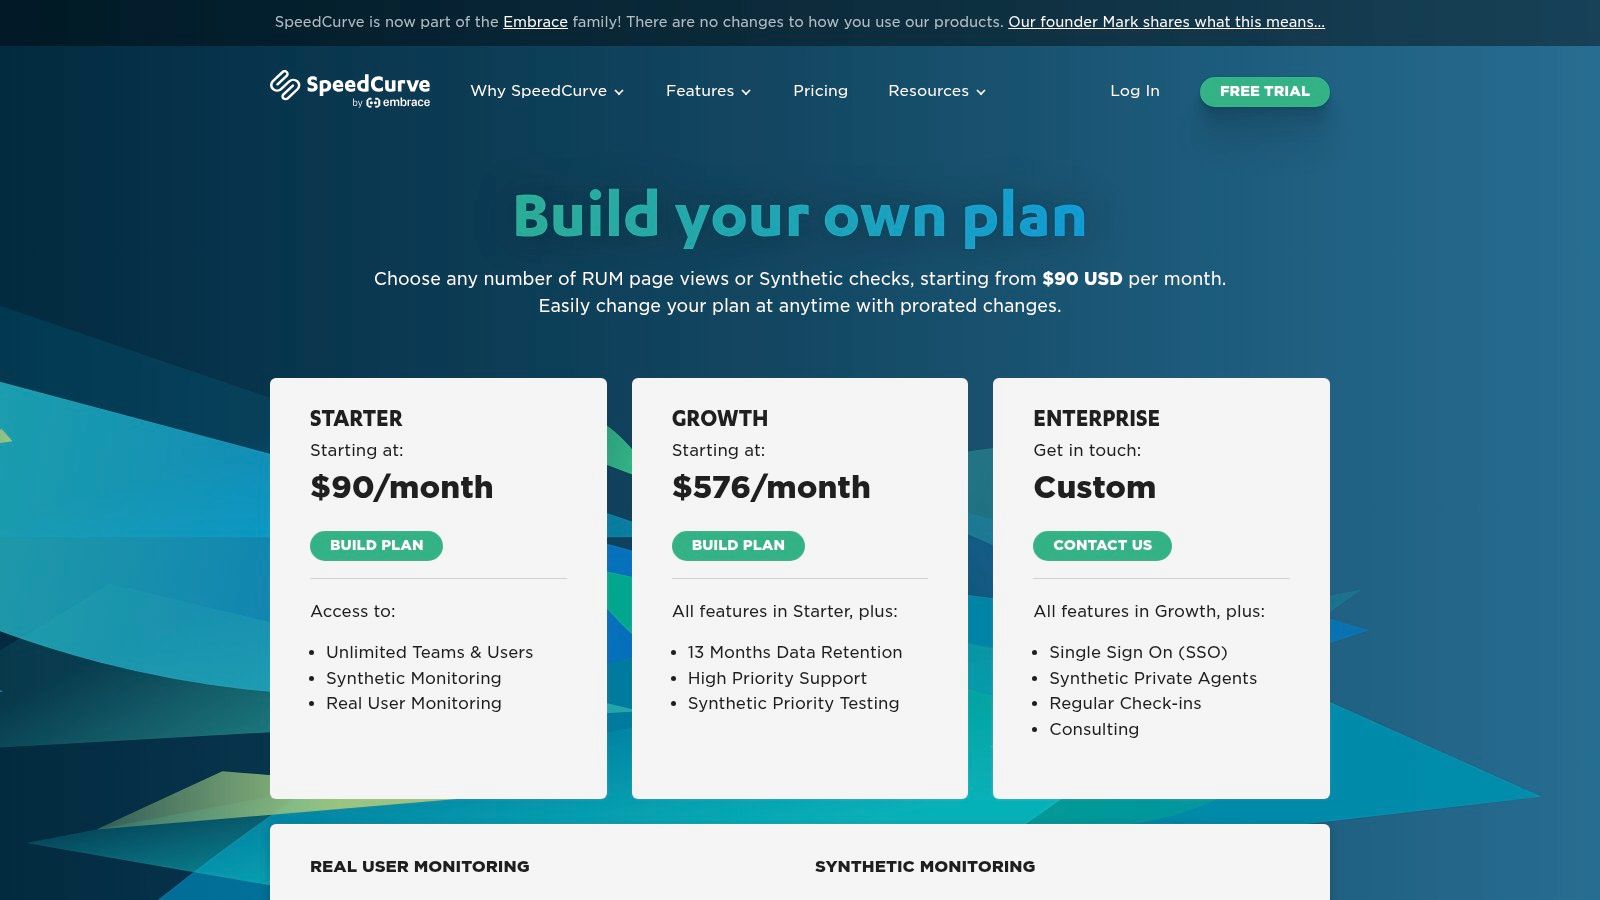
7. SpeedCurve
SpeedCurve is one of the most visually pleasing website performance monitoring tools, designed specifically for front-end developers, UX designers, and marketers who obsess over the user experience. It beautifully combines synthetic monitoring with Real User Monitoring (RUM), showing data not just as numbers but through cool filmstrips and comparison dashboards. This makes it incredibly easy to see exactly how your site renders for users and find out what’s slowing it down.
What really makes SpeedCurve special is its focus on “performance budgets.” You can set specific goals for metrics like Core Web Vitals or page size, and SpeedCurve will yell at you when you go over. This proactive approach helps teams catch performance issues before they affect users, turning performance from a reactive chore into a core part of the development culture. It’s less about simple uptime and more about building a fast, delightful experience.
Key Features & Use Cases
- Best For: Front-end development teams, UX designers, and e-commerce brands focused on optimizing the user-facing experience and Core Web Vitals.
- Performance Budgets: Set and enforce performance goals for key metrics, and get alerts when code changes or new features push you over budget.
- Strong Visualizations: Use filmstrip views and side-by-side video comparisons to visually diagnose rendering problems and understand the user experience.
- RUM and Synthetic Harmony: Combine real user data with controlled lab tests to get a complete picture of your site's performance in all kinds of conditions.
Pricing & Implementation
SpeedCurve’s pricing is based on a mix of monthly RUM pageviews and synthetic checks. Plans start at a higher base price than simple uptime monitors, because of its specialized features. The starter plan is solid, and all plans include unlimited users and teams, which is a huge plus for collaborative teams.
| Pros | Cons |
|---|---|
| Purpose-built for web performance and front-end optimization. | Starter plan begins at a higher price point than basic tools. |
| Excellent visualizations make complex data easy to understand. | Focus is mostly on the front-end, less on deep back-end diagnostics. |
| Performance budgets are a powerful feature for proactive monitoring. | Enterprise features like SSO require more expensive custom plans. |
| Unlimited users and teams are included even on the starter plan. |
Website: https://www.speedcurve.com/pricing/
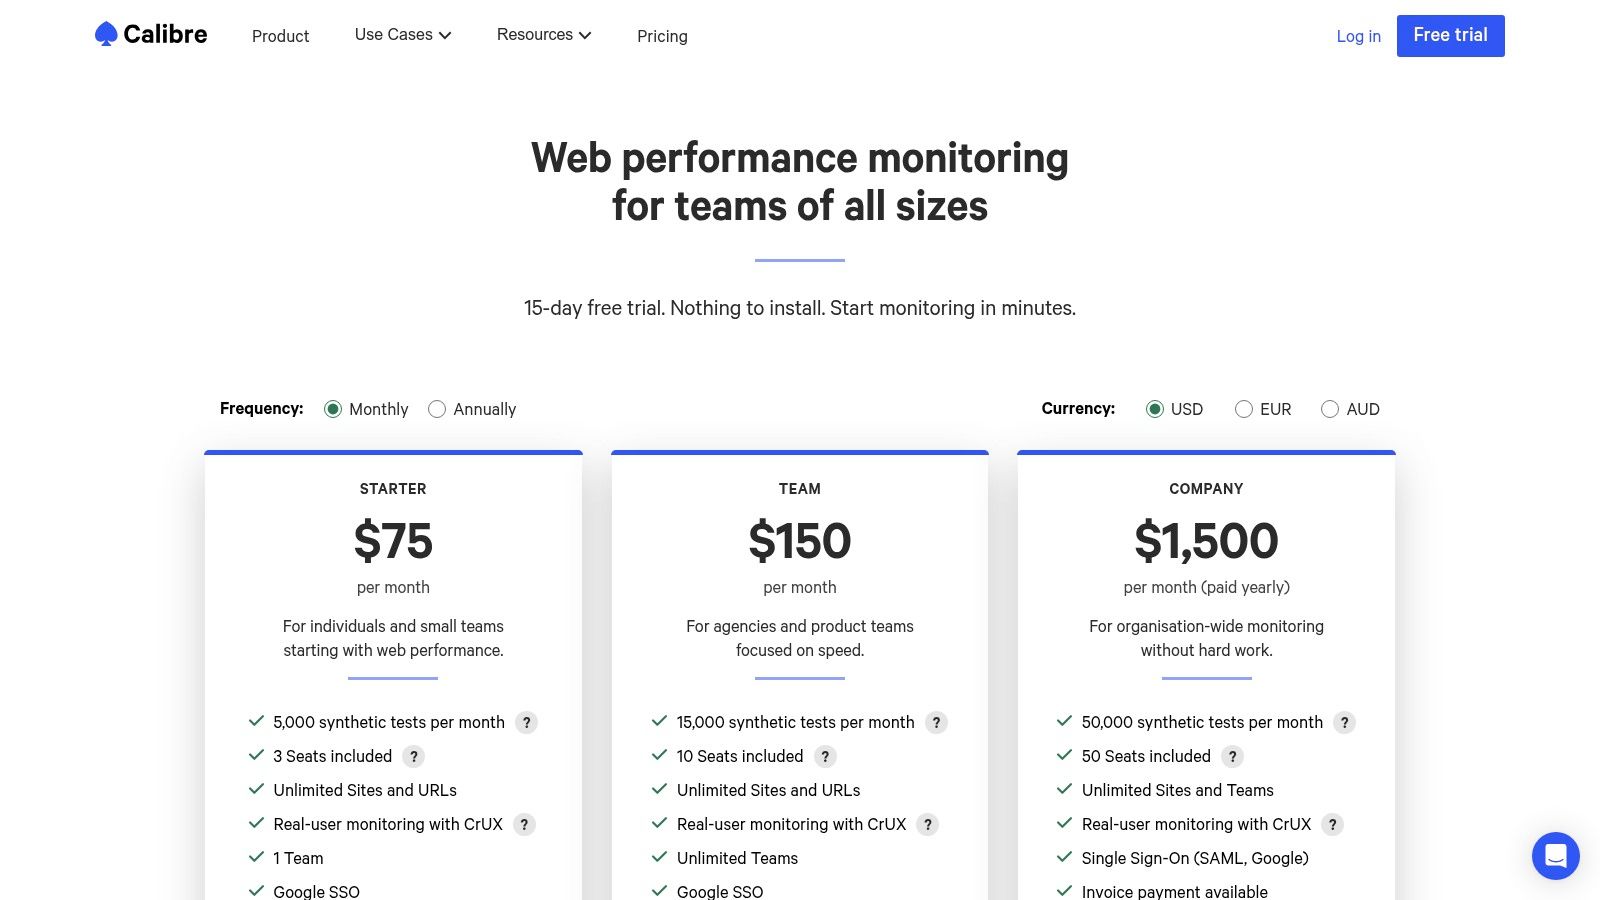
8. Calibre
Calibre is a website performance monitoring tool built for teams who love data but hate clunky interfaces. It focuses on giving you crystal-clear, actionable performance insights using synthetic testing, performance budgets, and deep integration with Google's Lighthouse and Chrome User Experience (CrUX) report. It’s perfect for agencies and product teams who need to prove performance improvements with beautiful, shareable reports.
What makes Calibre shine is its report-first workflow. Instead of just throwing charts at you, it helps you set performance budgets, so you get an alert before a new feature grinds your site to a halt. The platform turns complex metrics into clear pass/fail results against your goals, making it way easier to talk about performance with non-technical folks or clients. This focus on clear communication and proactive budgeting makes it a strategic tool, not just a reactive alarm.
Key Features & Use Cases
- Best For: Digital agencies, product teams, and developers who need to track Lighthouse scores over time and enforce performance budgets.
- Performance Budgets: Set specific limits for metrics like Largest Contentful Paint or bundle size, and get alerted when you're about to go over.
- Lighthouse & CrUX Integration: Automatically runs Lighthouse audits and pulls in real-user data from CrUX, giving you a powerful mix of lab and real-world data.
- Unlimited Sites/URLs: All paid plans include unlimited sites and URLs, making it great for agencies managing lots of client websites.
Pricing & Implementation
Calibre offers simple, clear tiers starting with a "Starter" plan at $75/month for individuals and small teams. The "Company" plan is priced for larger organizations and billed annually. All plans include team seats and Google SSO. Setup involves connecting your site and setting up your test profiles and locations.
| Pros | Cons |
|---|---|
| Strong reporting and budgeting workflow for stakeholders. | RUM insights are based on CrUX, not full session-level data. |
| Simple, transparent pricing tiers sized for teams. | The "Company" plan is billed yearly and is a big investment. |
| Unlimited sites and URLs included in every plan. | Less focus on back-end APM compared to full-stack platforms. |
| Excellent integration with Lighthouse and modern metrics. |
Website: https://calibreapp.com/pricing
9. Sematext Synthetics (Sematext Cloud)
Sematext Synthetics is a powerful yet surprisingly affordable player in the website performance monitoring tools game, perfect for teams who want predictable costs without giving up features. It’s part of the bigger Sematext Cloud platform, so its synthetic monitoring works closely with logs, infrastructure, and Real User Monitoring for a more complete view. This tool is built for those who need to simulate user journeys, check API endpoints, and monitor uptime from around the world without the sticker shock of bigger enterprise tools.
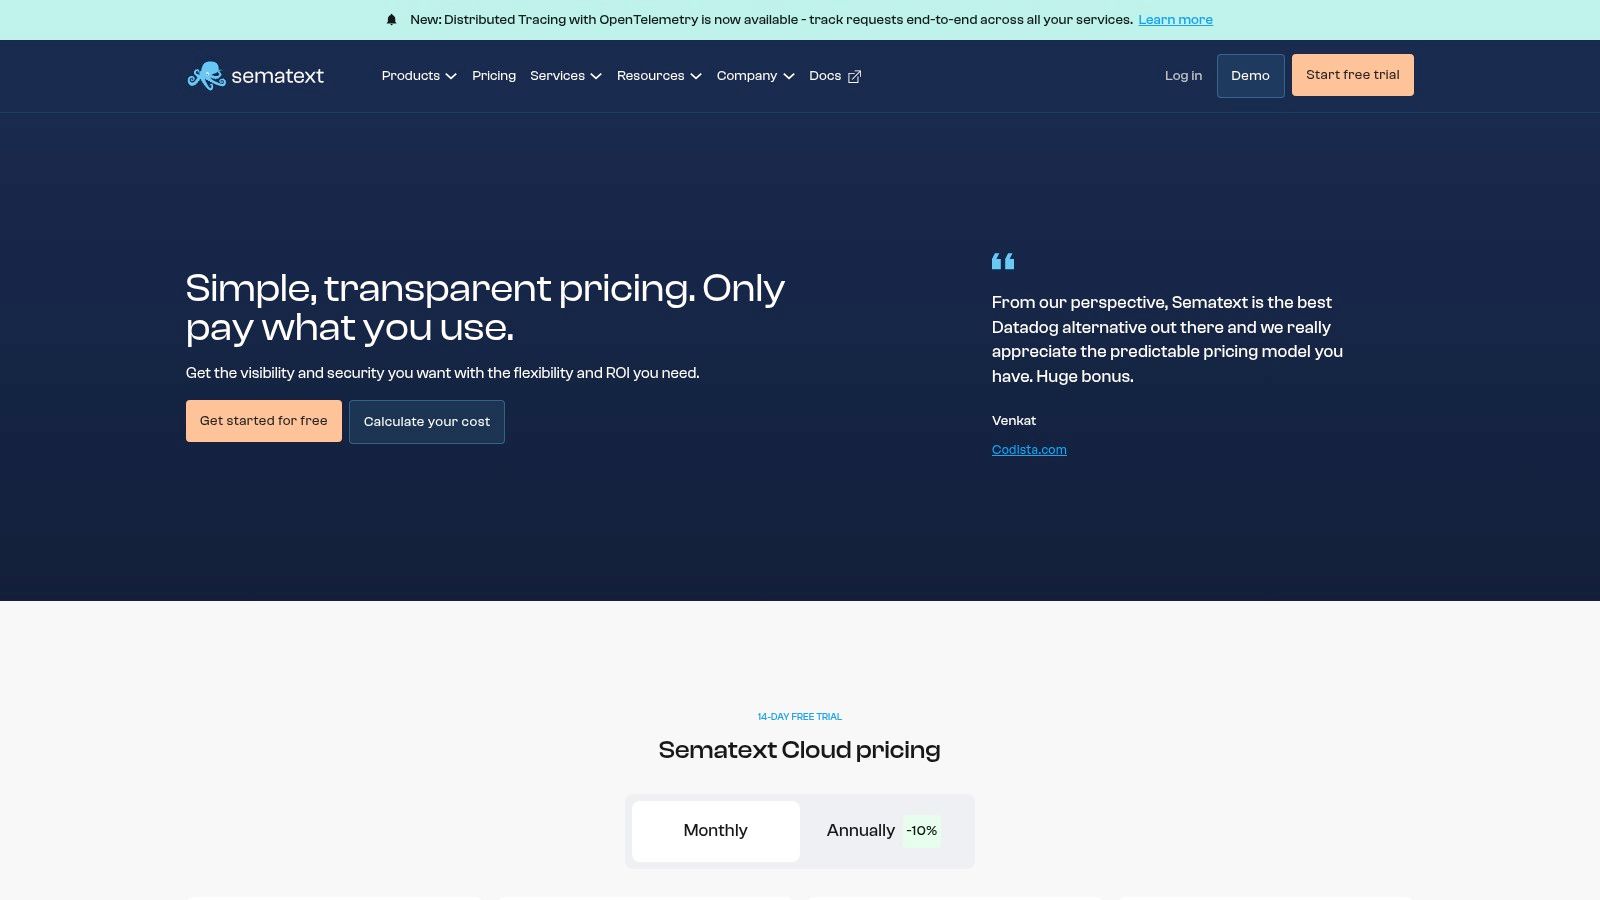
What makes Sematext stand out is its transparent, per-monitor pricing. You know exactly what you’re paying for, making it easy to scale up as you grow. The platform gives you detailed waterfall charts, Core Web Vitals tracking, and essential checks like SSL certificate expiry, giving you the critical data you need to proactively fix performance problems before your users even notice.
Key Features & Use Cases
- Best For: DevOps and engineering teams, SMBs, and startups looking for a cost-effective, all-in-one observability platform with simple pricing.
- HTTP & Browser Monitors: Set up simple uptime checks (HTTP) or script complex user interactions (browser monitors) to test critical funnels like logins or checkouts.
- Performance Vitals: Automatically tracks Core Web Vitals, provides waterfall charts for analysis, and captures screenshots to see what went wrong.
- Public Status Pages: Keep users in the loop during downtime with customizable status pages that build transparency and trust.
Pricing & Implementation
Sematext offers a pay-as-you-go pricing model that is highly predictable. Simple HTTP monitors start at just $2/month, and browser monitors start at $7/month, with a 14-day free trial to get started. Setup involves creating your monitors in the Sematext UI, with options for integrating into CI/CD pipelines.
| Pros | Cons |
|---|---|
| Very clear unit pricing and metered plans for predictable costs. | Browser run time and screenshots are limited on lower tiers. |
| Part of a unified observability platform (logs, RUM, etc.). | Fewer enterprise integrations than the biggest platforms. |
| Unlimited users and generous 14-day free trial. | Interface can be more technical compared to simpler tools. |
| Includes SSL/domain expiry checks and status pages. |
Website: https://sematext.com/pricing
10. Uptrends
Uptrends offers a full suite of website performance monitoring tools that are great at simulating complex user interactions. It combines synthetic monitoring for uptime, page speed, and multi-step transactions with Real User Monitoring (RUM) and API checks. This makes it a powerful choice for teams that need to check critical business flows from a global perspective. It's especially good at monitoring more than just a page load, like checking login forms, shopping carts, and internal search functions.
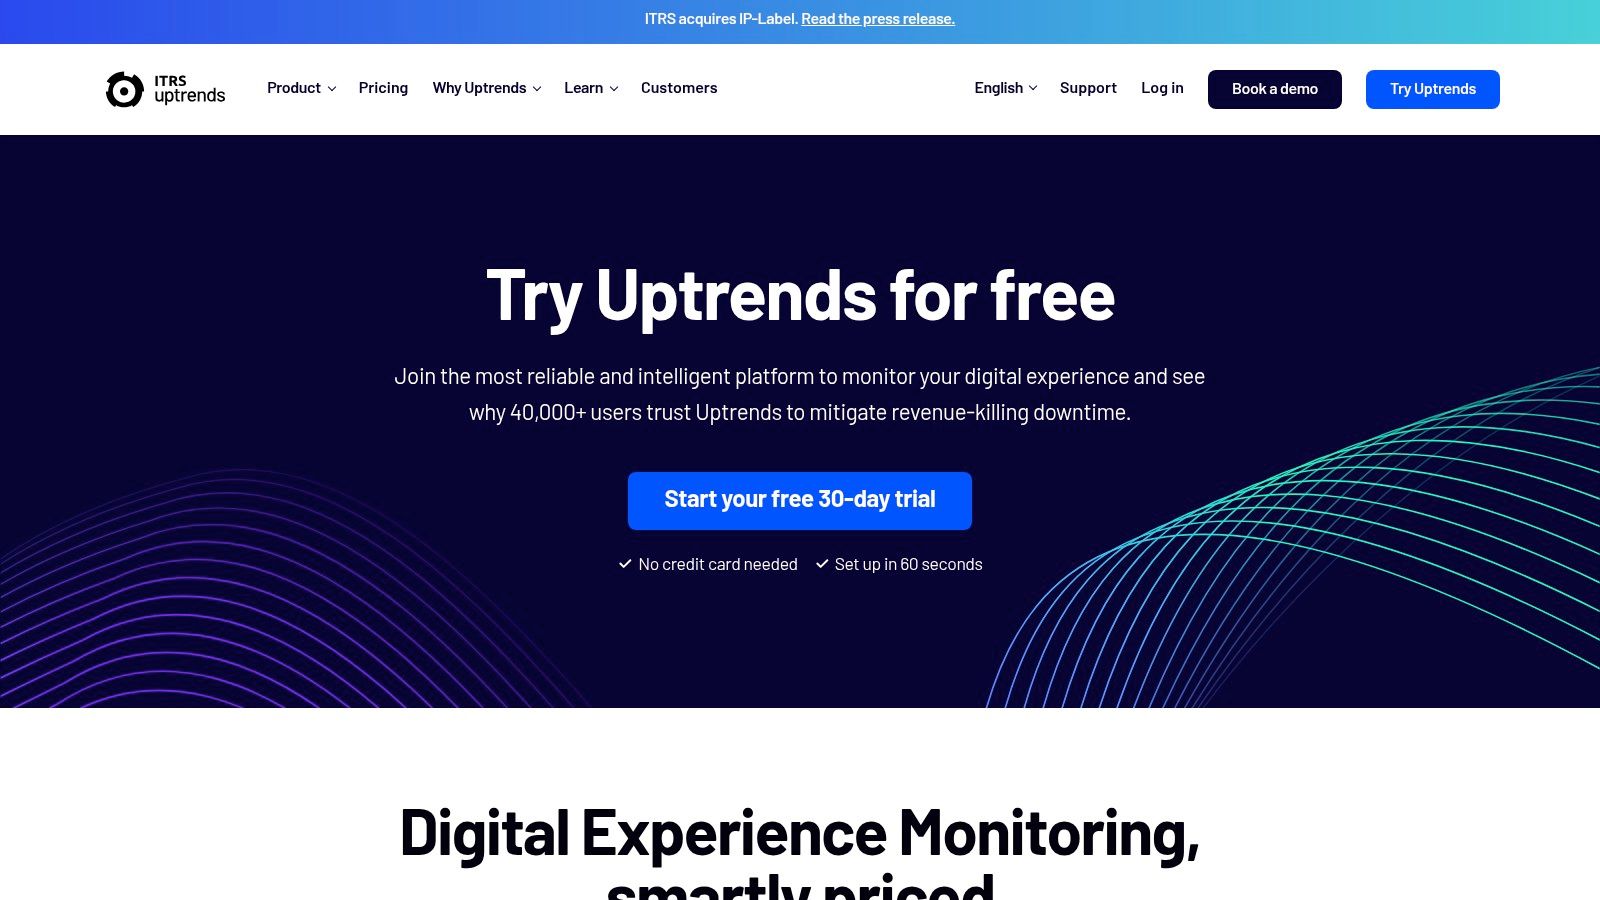
What makes Uptrends different is its user-friendly transaction recorder and multi-step API creator, which let non-developers build fancy monitoring checks without writing code. This accessibility, plus over 233 global checkpoints, gives deep insights into how different regions experience your app's functionality. The huge 30-day free trial also gives teams plenty of time to explore everything before buying.
Key Features & Use Cases
- Best For: E-commerce sites, SaaS platforms, and businesses with critical, multi-step user journeys that need constant checking.
- Transaction Recorder: Easily record and automate tests for critical user paths like creating an account, logging in, or checking out to make sure they always work.
- Multi-Step API Monitoring: Chain together API calls to test complex backend sequences, ensuring your app's services are talking to each other correctly.
- Global Checkpoints: Run performance and uptime tests from a massive network of global locations to accurately measure user experience worldwide.
- Real User Monitoring (RUM): Collect performance data from actual visitors to understand how your site performs on different browsers, devices, and networks in the real world.
Pricing & Implementation
Uptrends uses a flexible pricing model based on monthly subscription tiers, starting from around $17/month for a basic package. More advanced plans offer more checkpoints, data retention, and features like transaction monitoring. The setup is simple, with a web-based recorder that makes creating advanced checks an intuitive, point-and-click process.
| Pros | Cons |
|---|---|
| Very generous 30-day free trial to test all features. | UI is more operations-focused and less design-forward than some rivals. |
| Easy-to-use scenario builders for transactions and APIs. | Lacks the deep application code-level insights found in full APM suites. |
| Extensive global network of monitoring checkpoints. | Pricing can climb for teams needing high-frequency, complex checks. |
| Combines synthetic, RUM, and API monitoring in one platform. |
Website: https://www.uptrends.com
11. Better Stack (Better Uptime)
Better Stack carves out its spot by focusing intensely on uptime monitoring and incident management instead of deep performance analytics. It's the tool you grab when your main worry is knowing the second your site goes down and having a solid plan to alert the right person via phone call, SMS, or Slack. It’s less about why your site is slow and more about making sure it’s online, period.
What makes Better Stack so appealing, especially for startups and small businesses, is its simplicity and generous free tier. The platform combines uptime checks with beautiful, easy-to-set-up status pages and powerful on-call scheduling. This all-in-one approach means you can manage a critical outage—from detection to fixing it and telling the public—all in one streamlined place without paying for a dozen different services.
Key Features & Use Cases
- Best For: DevOps teams, startups, and SMBs who need a reliable, affordable incident management and uptime monitoring tool with great alerting.
- Incident Management: Create on-call schedules, escalate alerts automatically, and manage incidents right from Slack or Microsoft Teams.
- Reliable Alerting: Get notified by phone call, SMS, email, Slack, and 100+ other integrations to make sure no critical alert is ever missed.
- Status Pages: Quickly launch public or private status pages on a custom domain to keep stakeholders and users informed during downtime.
Pricing & Implementation
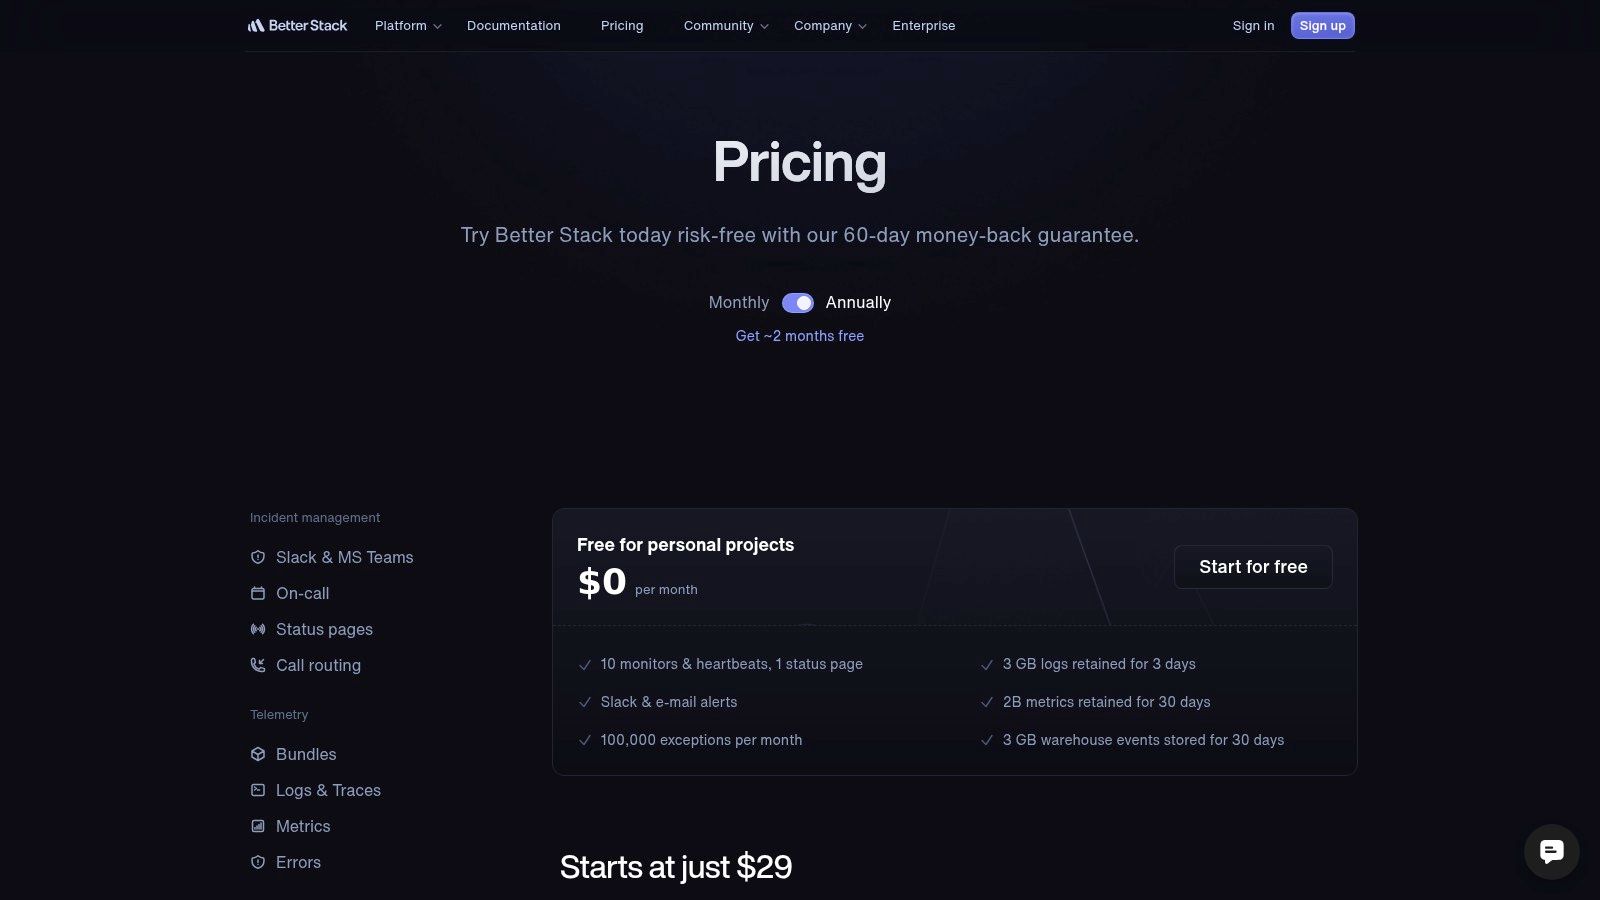
Better Stack offers a very generous free plan that includes 10 uptime monitors and a status page. Paid plans start at just $25/month, mostly adding more monitors, log capacity, and phone call alerts. Implementation is super fast; you can set up basic HTTPS checks and have your first status page live in under five minutes.
| Pros | Cons |
|---|---|
| Generous free plan and attractive entry-level pricing. | Focus is on uptime, not deep performance or transaction monitoring. |
| Excellent incident management and on-call scheduling tools. | Advanced performance diagnostics require other tools. |
| Clean, modern UI that is very easy to navigate. | Fewer global monitoring locations than some larger competitors. |
| Unlimited team members included in paid plans. |
Website: https://betterstack.com/pricing
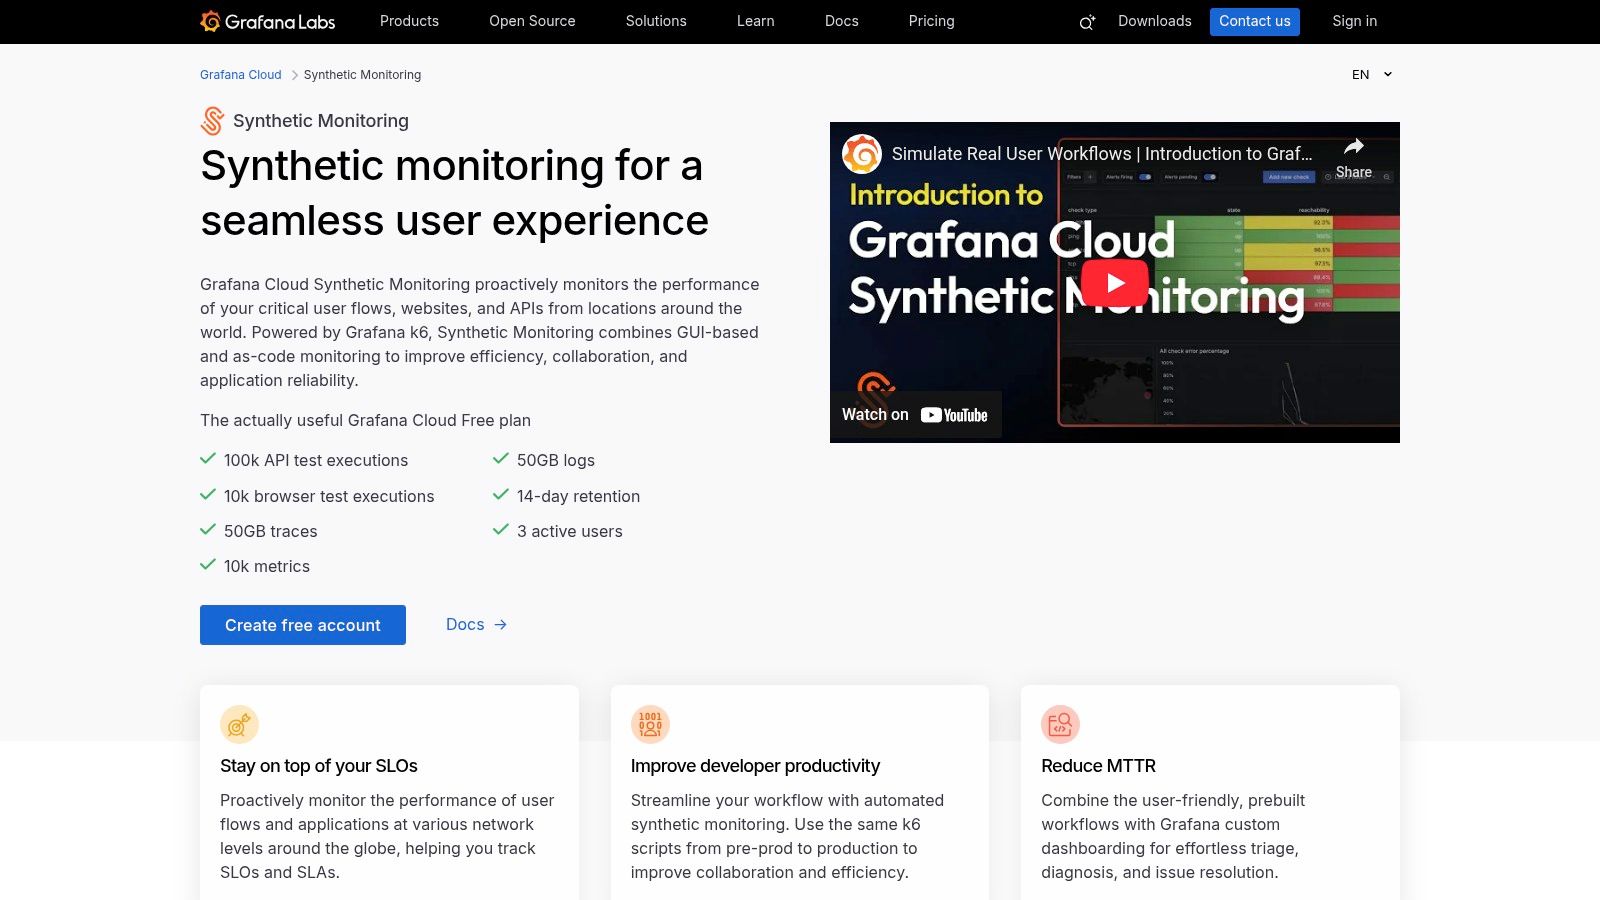
12. Grafana Cloud Synthetic Monitoring
For teams already living and breathing in the Grafana world, Grafana Cloud Synthetic Monitoring is a natural and powerful add-on. It goes beyond simple uptime by integrating synthetic API and browser tests directly into the observability platform you already use for metrics, logs, and traces. This is the go-to for engineering-heavy teams who want to combine their tools and connect synthetic performance data with deep-level server health in one unified view.
What makes Grafana's offering stand out among other website performance monitoring tools is its open-source spirit and developer-first approach. You can create tests with a no-code editor or, for more complex stuff, reuse existing scripts from k6, a popular open-source load testing tool. This flexibility, combined with its integration with Terraform, API, and CLI management, makes it incredibly powerful for teams practicing infrastructure-as-code and modern DevOps workflows.
Key Features & Use Cases
- Best For: DevOps and SRE teams already using Grafana, developers who want to use k6 scripts for monitoring, and organizations wanting a unified observability platform.
- Integrated Observability: Natively connect synthetic test failures with underlying metrics, logs, and traces within Grafana dashboards to find root causes faster.
- k6 Script Reusability: Reuse existing k6 load testing scripts for continuous synthetic monitoring, which makes creating and maintaining tests much easier.
- Generous Free Tier: The free forever plan includes a huge number of API and browser test runs, making it one of the easiest options to get started with.
Pricing & Implementation
Grafana Cloud has a usage-based, pay-as-you-go model. The free tier is quite generous, offering thousands of monthly test runs. Paid plans scale with your usage, with clear prices for API and browser test runs. Setup is easy for those familiar with Grafana; you can configure probes and alerts right in the Grafana Cloud UI.
| Pros | Cons |
|---|---|
| Generous free tier and clear, usage-based pricing. | Browser test overage pricing is a lot higher than API test pricing. |
| Deep integration with the entire Grafana observability stack (metrics, logs). | Enterprise features like advanced support and SSO require larger plans. |
| Combines synthetics, RUM, and k6 load testing in one platform. | Can be overkill if you only need simple uptime monitoring. |
| Powerful developer-centric features like Terraform and API management. |
Website: https://grafana.com/products/cloud/synthetic-monitoring/
Top 12 Website Performance Monitoring Tools Comparison
| Product | Core features | Key benefits | Target audience | Unique selling points | Pricing & trial |
|---|---|---|---|---|---|
| MetricsWatch | Automated white‑label Reports; real‑time Alerts; GA4 Health Scan | Saves hours on client reporting; fast anomaly detection (~10 min) with low noise | Marketers, agencies, product teams | Full white‑label; 5‑min Alerts setup; free GA4 Health Scan (~30s) | From $49/mo (2 reports) & $99/mo (3 alerts); free trial, no credit card |
| SolarWinds Pingdom | Synthetic uptime, page speed, multi‑step transactions; RUM | Simple uptime & performance insights; easy setup | Marketing & web teams | RUM with 13‑month retention; public status pages | Configurator pricing (no fixed simple tiers) |
| Datadog Synthetics | Code‑free API/browser/mobile tests; integrates with RUM/APM/logs | Full‑stack visibility; faster root‑cause analysis | Engineering & observability teams | Deep ecosystem integrations; unified dashboards | Usage‑based pricing; clear Synthetics list pricing |
| New Relic (WPM) | Synthetics for uptime, Core Web Vitals, SSL; multi‑location checks | Unified RUM/APM/logs; generous free allocations | Teams wanting unified observability | Transparent overage ($0.005/non‑ping check); large free checks | Usage‑based with free tier allocations |
| Dynatrace (DEM) | RUM + synthetics with AI (Davis) and Smartscape topology | End‑to‑end context and AI‑assisted root cause | Large enterprises / ops teams | AI root‑cause, service topology, scalable retention | Unit pricing for actions/requests; enterprise model |
| Catchpoint | Synthetics, RUM, DNS/CDN/BGP monitoring; 3,000+ agents | Deep internet‑layer visibility and resilience insights | Enterprises needing global internet monitoring | Massive global vantage points; layer‑deep diagnostics | Higher entry price; enterprise plans |
| SpeedCurve | Synthetic + RUM focused on Core Web Vitals and UX | Strong visualizations, budgets, UX metrics for front‑end | Front‑end, UX, and marketing teams | Filmstrips, performance budgets, UX‑centric reports | Starter higher than simple uptime tools; tiered plans |
| Calibre | Synthetic tests, performance budgets, Lighthouse & CrUX RUM | Report‑oriented UI for clear performance reporting | Agencies and product teams | CrUX‑integrated real‑user insights; simple reporting workflows | Transparent team‑sized tiers; company plan billed yearly |
| Sematext Synthetics | HTTP/browser monitors, screenshots, waterfalls; status pages | Predictable metered pricing; pay‑as‑you‑go monitoring | Cost‑sensitive teams needing clear unit costs | Clear unit pricing, private locations, CI/CD hooks | Metered pricing; 14‑day free trial |
| Uptrends | RUM, synthetic page/transaction monitoring; multi‑step scenarios | Easy scenario builders; flexible capacity via credits | Teams needing multi‑step transaction checks | Credit‑based sizing; long 30‑day free trial | Credit‑based pricing; 30‑day trial |
| Better Stack (Better Uptime) | Uptime checks, incident workflows, on‑call schedules, SMS | Simple incident management with on‑call tools | SMBs and ops teams focused on incident response | Phone/SMS alerts, native incident workflows | Attractive entry price; 60‑day money‑back guarantee |
| Grafana Cloud Synthetic Monitoring | API & browser synthetics; k6 integration; Grafana dashboards | Generous free tier; integrates with observability stack | Teams using Grafana / open‑source tooling | No‑code tests or k6 scripts; correlate with dashboards | Usage‑based with generous free limits; enterprise options |
So, Which Monitoring Tool Won't Put You to Sleep?
We’ve journeyed through a dozen of the best website performance monitoring tools, from the all-seeing eyes of Datadog to the laser-focused simplicity of Better Stack. It’s a lot to take in, and if your brain feels like it just ran a marathon through a field of acronyms (RUM, APM, TTFB!), you're not alone. The truth is, there’s no single "best" tool. The best tool is the one you’ll actually use.
A fancy monitoring platform with a million dashboards is useless if it gathers digital dust. A 2021 study by New Relic found that while 79% of organizations believe observability is critical, many still struggle to actually use it effectively. The goal isn't to collect every byte of data possible; it’s to get useful insights that stop those dreaded "the website is down" emails from flooding your inbox.
Finding Your Perfect Fit: A Quick Recap
Let's break it down. Your choice really depends on your job and biggest headache.
- For Digital Marketing Agencies & Client-Facing Teams: Your life is all about proving value without drowning clients in tech speak. You need clean, automated reporting that highlights what matters. This is where tools built for communication, not just diagnostics, are your best friends. A platform that emails reports directly to stakeholders is a game-changer.
- For In-House Dev & Ops Teams: You live and breathe the tech stack. You need to trace a slow database query back to a specific line of code. A full-on observability suite like Dynatrace, New Relic, or Datadog is your command center. For a deeper technical dive into this category, you could also check out a detailed application performance monitoring tools comparison to see how these heavy-hitters stack up.
- For E-commerce Managers & SMBs: You care about user experience and how it directly affects sales. You need to know instantly if your checkout page slows down. A mix of synthetic monitoring (like Pingdom or Uptrends) and real user monitoring is your sweet spot, giving you both proactive checks and real-world performance data.
Your Actionable Next Steps
Feeling overwhelmed? Don't be. Here’s a simple plan to move forward without signing up for a dozen free trials you’ll forget about.
- Define Your One Big Problem: What's the single most annoying performance issue you have? Is it slow load times? Frequent outages? Reporting nightmares? Start there.
- Pick Two Contenders: Based on that problem, choose just two tools from our list that seem like a good fit. One should be a simple, focused tool, and the other can be a more comprehensive option.
- Run a Meaningful Trial: Don't just check your homepage. Monitor your most important user journey, like the login process or adding an item to the cart. Set up alerts and see if they’re helpful or just noise.
- Evaluate the Interface: Can you find what you need in under 30 seconds? If the user experience is a disaster, your team won't use it, period.
The ultimate goal of using these website performance monitoring tools isn’t just to get a faster website; it's to get your time back and stress less. It's about spending less time putting out fires and more time building cool stuff. Pick the tool that helps you sleep better at night, knowing your digital storefront is in good hands. Now go make your site ridiculously fast.
Tired of manually compiling performance reports and trying to explain bounce rates to clients? MetricsWatch automates the entire process, delivering professional, easy-to-understand analytics reports from tools like Google Analytics directly to your team's or clients' inboxes. Skip the dashboards and get the insights you need, when you need them, with a free trial of MetricsWatch.


