
Campaign Reports: What They Are & How to Make One
Campaign Reports: What They Are & How to Make One
Campaign Reports: What They Are & How to Make One
Are you trying to build a campaign report, but not sure the best way of going about it?
Campaign reports are like a detailed marketing report for a single campaign. They allow you to place a microscope over one of your marketing campaigns to see if it's working or if it needs to be revamped.
But building these reports the RIGHT WAY can be tricky.
That's why, in today's post, we'll teach you 5 steps that you'll need to follow to build effective campaign reports. Before we do, though, let's get clear on what these reports are and why they matter.
What Is a Campaign Report?
A campaign report is a marketing document that shows your business's performance for a particular campaign.
Campaign reports display all the key activities you did to promote your product or service during a specific timeframe, and how well they worked (like their cost/effectiveness in terms of time invested vs money gained from sales).
In other words, these reports are designed to give you an in-depth understanding of how your marketing campaigns are performing.
Ok, but that still begs the question, "Why do you need campaign reports?"
Campaign reports help you discover and fix the weak points that harm your business's efforts to gain new customers through their website or social media platforms.
For example, if one campaign is doing really well (meaning it has a high conversion rate), but another one isn't, you know what to do: revamp your poorly performing campaign based on strategies from the successful one.
Campaign reports also help you understand how well a specific marketing channel (like organic search) is working for you, so that you can allocate more of your budget to it and less on other channels that aren't delivering results.
Now that we know what campaign reports are and why they're important, let's look at the 5 steps you'll need to keep in mind to build the right kind.
How to Build a Campaign Report in 5 Easy Steps
1) Determine Your KPIs FIRST
Campaign reports are meant to help you gain insights about your marketing, so the first step is to determine what KPIs (or key performance indicators) you want them to show.
For example, if your goal was "we wanted our campaign report's KPI to be Facebook likes," then the number of likes on each post would probably be the key KPI you'll want to look at when evaluating your campaign.
But if your goal was "we wanted our campaign report's KPI to be Facebook custom audience reach," then the number of people who saw each post would probably be a more accurate representation of how well it performed.
The point here is that, in order for your campaign reports to be effective, you need to determine what your goal was for each marketing strategy before you build them.
This is important because one of the main purposes of these reports is to help you figure out how well a specific activity has performed in comparison with others (like Facebook posts vs organic searches).
If they're not built accurately then you risk being misled by the results.
One last thing to mention here is that you'll need to get clear on the difference between a "metric" and a "KPI."
A metric is a neutral piece of data that is neither good or bad (it just IS).
A KPI, on the other hand, is a metric that either exceeds or falls below a specific goal.
Let's say you wanted to improve your organic searches. So each month, you check Google Analytics.
If you see that you have 10,000 organic visitors each month, that's a metric.
It's only when you say, "I want 15,000 organic visitors each month" that you know whether the metric is good or bad.
Since you have 10,000 organic visitors, but you wanted 15,000, you'll need to figure out a new way to increase traffic from organic channels.
For more information on this, check out this in-depth resource: What KPI Metrics Make a Valuable Report for Small Businesses.
The point is that you need to have clear and concrete goals for your campaigns if you want to build effective reports.
2) Limit the Number of KPIs You Track
Campaign reports are meant to be an in-depth look at how your marketing strategies performed. But if you track too many KPIs then it'll take forever for anyone to go through them.
Even worse, they might not even care to look at the results if you repeatedly send updated reports (which defeats the purpose of building a report in the first place!).
To avoid this problem, limit yourself to just a few KPIs per campaign.
That's why it's important to choose wisely when choosing the right KPIs for your report. Focus on the ones that will be the biggest needle pushers for your business.
A good rule of thumb is to select 3 - 5 high-impact (meaning the data can be used for practical change) KPIs for each of your campaigns.
3) Decide Who Needs This Information

Campaign reports are meant to give you a bird's-eye view of how your marketing strategies performed.
But the information in them is only valuable if it reaches the right people at the right time.
For example, let's say that one month all of your campaigns fail and none of your KPIs are met (which would be devastating).
But the person who needs to know this is your boss, not all of your employees.
On the other hand, if you're a marketing agency and it was one client's campaign that failed (and another client's that succeeded), then sharing these results with just your team won't cut it.
You need everyone - including your clients - to see this information.
So before you build a campaign report, decide who needs the information and when they need it by.
This will help make sure that everyone gets what they need at the right time (which ensures their success).
4) Transform Numeric Data into Visual Data
This is the secret to making campaign reports that are easy to understand and therefore more actionable.
What I mean by "visual data" is that you're taking the numeric information and transforming it into visually appealing charts, graphs, or benchmarks.
For example: instead of just giving someone a list of numbers (like visits to your blog), turn those numbers into something visual like this chart:
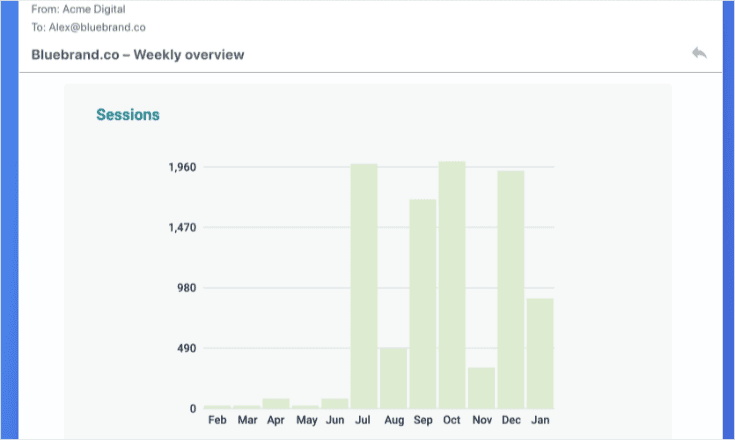
See how much better that is? Not only is it clearly showing you the results (which is helpful) but it's also easy to understand.
If possible, you should try to take every piece of numeric data and either turn it into a chart or graph or add something visual onto the report itself.
That way everyone can quickly see what's working and what isn't - which means they'll be better equipped to make the necessary changes.
5) Set up Automated Reports
The point of making campaign reports is so that you can quickly see how your marketing strategies performed.
That way, if something's working well, it'll be easy to keep or even increase the budget for that strategy. And if a tactic isn't performing as expected (or at all), then you won't waste time trying to improve what's not working.
But you can't get this information if it takes a ton of time and effort to compile the data in the first place.
Which is why automated reports are so valuable; they'll save everyone involved tons of time (which means more money saved).
To set up an automated report, all you need to do is get started with a report building tool like Metrics Watch:
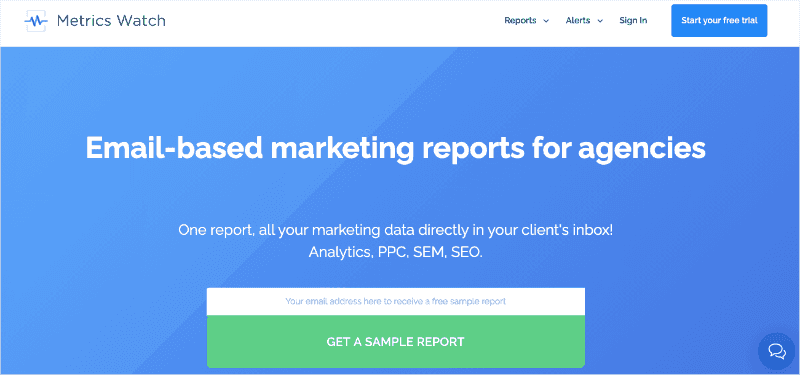
Metrics Watch is hands down one of the best campaign report builders on the market.
That's because it has a codeless drag and drip report builder, so there are ZERO coding or "tech skills" required.
Plus, you'll be able to track campaigns from your favorite marketing channels, such as:
Google Analytics
Google Search Console
Google Ads
Facebook (paid and organic)
Instagram (paid and organic)
LinkedIn (paid and organic)
Mailchimp
Once you've built your campaign reports, you can determine who needs to receive them and when.
Then the data will automatically be compiled and sent to your recipients. And since you can remove all Metrics Watch branding, your team or clients will think these are strictly internal reports produced by your company.
But the best part is how this data is shared. Not only are there visual graphs, charts, and lists, but the information is sent directly to your recipients' inbox.
That means no more messy PDFs to organize or 3rd-party dashboards to share login information.
Instead, you can send this information to the people who need it in a format they already know and use.
And that's all for today! This has been an in-depth post on 5 steps to building a campaign report.
I hope you enjoyed this post and, if you did, you'll definitely want to look at the following resources:
These articles will have even more information on how you can build smarter marketing reports that rely on data to grow your business.
Ready to see Metrics watch in action for yourself? Just click below to start your FREE Metrics Watch trial today (no credit card required):
Are you trying to build a campaign report, but not sure the best way of going about it?
Campaign reports are like a detailed marketing report for a single campaign. They allow you to place a microscope over one of your marketing campaigns to see if it's working or if it needs to be revamped.
But building these reports the RIGHT WAY can be tricky.
That's why, in today's post, we'll teach you 5 steps that you'll need to follow to build effective campaign reports. Before we do, though, let's get clear on what these reports are and why they matter.
What Is a Campaign Report?
A campaign report is a marketing document that shows your business's performance for a particular campaign.
Campaign reports display all the key activities you did to promote your product or service during a specific timeframe, and how well they worked (like their cost/effectiveness in terms of time invested vs money gained from sales).
In other words, these reports are designed to give you an in-depth understanding of how your marketing campaigns are performing.
Ok, but that still begs the question, "Why do you need campaign reports?"
Campaign reports help you discover and fix the weak points that harm your business's efforts to gain new customers through their website or social media platforms.
For example, if one campaign is doing really well (meaning it has a high conversion rate), but another one isn't, you know what to do: revamp your poorly performing campaign based on strategies from the successful one.
Campaign reports also help you understand how well a specific marketing channel (like organic search) is working for you, so that you can allocate more of your budget to it and less on other channels that aren't delivering results.
Now that we know what campaign reports are and why they're important, let's look at the 5 steps you'll need to keep in mind to build the right kind.
How to Build a Campaign Report in 5 Easy Steps
1) Determine Your KPIs FIRST
Campaign reports are meant to help you gain insights about your marketing, so the first step is to determine what KPIs (or key performance indicators) you want them to show.
For example, if your goal was "we wanted our campaign report's KPI to be Facebook likes," then the number of likes on each post would probably be the key KPI you'll want to look at when evaluating your campaign.
But if your goal was "we wanted our campaign report's KPI to be Facebook custom audience reach," then the number of people who saw each post would probably be a more accurate representation of how well it performed.
The point here is that, in order for your campaign reports to be effective, you need to determine what your goal was for each marketing strategy before you build them.
This is important because one of the main purposes of these reports is to help you figure out how well a specific activity has performed in comparison with others (like Facebook posts vs organic searches).
If they're not built accurately then you risk being misled by the results.
One last thing to mention here is that you'll need to get clear on the difference between a "metric" and a "KPI."
A metric is a neutral piece of data that is neither good or bad (it just IS).
A KPI, on the other hand, is a metric that either exceeds or falls below a specific goal.
Let's say you wanted to improve your organic searches. So each month, you check Google Analytics.
If you see that you have 10,000 organic visitors each month, that's a metric.
It's only when you say, "I want 15,000 organic visitors each month" that you know whether the metric is good or bad.
Since you have 10,000 organic visitors, but you wanted 15,000, you'll need to figure out a new way to increase traffic from organic channels.
For more information on this, check out this in-depth resource: What KPI Metrics Make a Valuable Report for Small Businesses.
The point is that you need to have clear and concrete goals for your campaigns if you want to build effective reports.
2) Limit the Number of KPIs You Track
Campaign reports are meant to be an in-depth look at how your marketing strategies performed. But if you track too many KPIs then it'll take forever for anyone to go through them.
Even worse, they might not even care to look at the results if you repeatedly send updated reports (which defeats the purpose of building a report in the first place!).
To avoid this problem, limit yourself to just a few KPIs per campaign.
That's why it's important to choose wisely when choosing the right KPIs for your report. Focus on the ones that will be the biggest needle pushers for your business.
A good rule of thumb is to select 3 - 5 high-impact (meaning the data can be used for practical change) KPIs for each of your campaigns.
3) Decide Who Needs This Information
Campaign reports are meant to give you a bird's-eye view of how your marketing strategies performed.
But the information in them is only valuable if it reaches the right people at the right time.
For example, let's say that one month all of your campaigns fail and none of your KPIs are met (which would be devastating).
But the person who needs to know this is your boss, not all of your employees.
On the other hand, if you're a marketing agency and it was one client's campaign that failed (and another client's that succeeded), then sharing these results with just your team won't cut it.
You need everyone - including your clients - to see this information.
So before you build a campaign report, decide who needs the information and when they need it by.
This will help make sure that everyone gets what they need at the right time (which ensures their success).
4) Transform Numeric Data into Visual Data
This is the secret to making campaign reports that are easy to understand and therefore more actionable.
What I mean by "visual data" is that you're taking the numeric information and transforming it into visually appealing charts, graphs, or benchmarks.
For example: instead of just giving someone a list of numbers (like visits to your blog), turn those numbers into something visual like this chart:
See how much better that is? Not only is it clearly showing you the results (which is helpful) but it's also easy to understand.
If possible, you should try to take every piece of numeric data and either turn it into a chart or graph or add something visual onto the report itself.
That way everyone can quickly see what's working and what isn't - which means they'll be better equipped to make the necessary changes.
5) Set up Automated Reports
The point of making campaign reports is so that you can quickly see how your marketing strategies performed.
That way, if something's working well, it'll be easy to keep or even increase the budget for that strategy. And if a tactic isn't performing as expected (or at all), then you won't waste time trying to improve what's not working.
But you can't get this information if it takes a ton of time and effort to compile the data in the first place.
Which is why automated reports are so valuable; they'll save everyone involved tons of time (which means more money saved).
To set up an automated report, all you need to do is get started with a report building tool like Metrics Watch:
Metrics Watch is hands down one of the best campaign report builders on the market.
That's because it has a codeless drag and drip report builder, so there are ZERO coding or "tech skills" required.
Plus, you'll be able to track campaigns from your favorite marketing channels, such as:
Google Analytics
Google Search Console
Google Ads
Facebook (paid and organic)
Instagram (paid and organic)
LinkedIn (paid and organic)
Mailchimp
Once you've built your campaign reports, you can determine who needs to receive them and when.
Then the data will automatically be compiled and sent to your recipients. And since you can remove all Metrics Watch branding, your team or clients will think these are strictly internal reports produced by your company.
But the best part is how this data is shared. Not only are there visual graphs, charts, and lists, but the information is sent directly to your recipients' inbox.
That means no more messy PDFs to organize or 3rd-party dashboards to share login information.
Instead, you can send this information to the people who need it in a format they already know and use.
And that's all for today! This has been an in-depth post on 5 steps to building a campaign report.
I hope you enjoyed this post and, if you did, you'll definitely want to look at the following resources:
These articles will have even more information on how you can build smarter marketing reports that rely on data to grow your business.
Ready to see Metrics watch in action for yourself? Just click below to start your FREE Metrics Watch trial today (no credit card required):
Start sending automated reports today
Start your free trial, no credit card required!
or
Start sending automated reports today
Start sending automated reports today
Start your free trial, no credit card required!
or