
CMO Dashboard: 7 KPIs You Need to Include
CMO Dashboard: 7 KPIs You Need to Include
CMO Dashboard: 7 KPIs You Need to Include
Are you wondering which metrics belong in your Chief Marketing Officer (CMO) dashboard?
Creating a weekly or monthly marketing report is essential for CMOs in any niche. These reports let you know which of your marketing strategies are on track and which ones could use a little work.
That's why, in today's post, we're going to look at 7 KPIs every CMO dashboard or marketing report should track.
But first, let's get clear on what a CMO is and why their role absolutely requires custom reports.
What Is a Chief Marketing Officer (CMO)?
A CMO is the chief executive officer for all marketing efforts. Their goal is to increase awareness of their company and its products, as well as gain new customers.
While this responsibility varies widely from industry to industry, CMOs need a consistent way to measure how effective they are at reaching those goals - which means reports every week or month.
This is where a CMO dashboard comes in.
A CMO dashboard is exactly what it sounds like: it's a collection of KPIs that are specifically catered to the role.
Having access to these KPIs is crucial for the success of any CMO. Why? Because these marketing reports:
Highlight your weaknesses
Let you double-down on your strengths
Keep your team under budget
Justify your role to clients or upper management
At the end of the day, there's simply no reason for leaving your marketing strategy up to "your gut."
Instead, you simply need to track the right KPIs to make sure you're on the track.
With that in mind, let's look at some common KPIs every CMO should add to their dashboard or marketing report.
7 KPIs for Your CMO Dashboard
1) Pageviews

We'll start with the most basic of all metrics: pageviews.
While traffic is always a great metric to track, it's important not to get caught in a trap. Why? Because traffic can be deceiving - and sometimes you have no idea why your site has more or less visitors than normal.
That said, pageviews are important because they tell investors and clients just how many people you have a chance of reaching - and that's exactly what you want to show them.
If your pageviews go up, it means more people are seeing your site and interacting with your content, which is a great thing for any CMO looking to increase their presence online.
On the flip side, if pageviews decline or stagnate, then there may be an issue with your content. If you're struggling with this, schedule a meeting with your team to get some feedback on what may have changed about your marketing strategy that caused the decline in traffic.
The point is that this KPI gives you a general idea about whether your online presence is growing or decreasing.
Once pageviews are up and steady, then it's time to move onto new vs. returning visitors.
2) New vs. Returning Visitors
Every marketer knows that it's harder to convert new visitors than returning ones.
That said, if your site has a low percentage of new visitors compared to returning ones, you may want to look at how often you send out promotional emails or newsletters.
If the answer is "not enough," then take some time this month to schedule more outreach emails.
If, however, your site has a high percentage of new visitors every month or week, then you need to look at why that's happening - and what changes can be made to reduce the number of first-time visitors.
For example: is there something wrong with your website? Are people just stumbling across it? Or is your content so good that new people are converting faster than ever before?
There's no right answer to this question, but it gives you the data you need to stay ahead of what's working and what isn't.
3) Conversion Rates

Every marketer wants to increase their conversion rate, as it means that your company is converting more visitors into customers.
The problem with this metric: oftentimes entrepreneurs and marketers neglect to track the right metrics in order to get a full picture of what's working and what isn't - which can lead to wasted time or money down the line.
If you're looking to increase your conversion rate, then it's important to know what steps led up to a customer signing up for (or purchasing) something from your site.
For example: did they visit the product page? Did they sign up for an email list before making their purchase? Or did they only read three blog posts before signing up?
As you can see, there are a number of factors that go into increasing your conversion rate. That makes it even more important to track the right metrics in order to determine what works and what doesn't.
Once you've found which pieces of content work best at converting visitors into customers (and getting them to stick around), then you'll know what types of content to focus on moving forward.
4) Social Media Engagement and Growth
Every marketer is always looking for ways to get more engagement on social media, but it can be difficult to track which channels are the most effective at getting your content out there.
That's where tracking the following metrics comes into play:
Total likes
Followers
Shares
And more...
For example: if you want to increase brand awareness for your company, then tracking likes and shares is a great place to start.
However, if you're looking to drive more traffic back to your site or generate leads through social media (by sharing blog posts), then focus on measuring followers instead of just engagement rates.
The last thing any CMO wants is for their marketing team isn't gaining any traction on social media.
That's why it's important to take the time every month or so and track your growth rates across all channels - that way, you can determine which ones are bringing in the most traffic (and growing at a steady pace).
For this to work for YOUR business, though, you'll need to get clear on your social media goals.
Then you can better determine which KPI will best reflect the success of your social media strategy.
5) Email Open and Click-Through Rates
Email marketing is still one of the most effective ways to reach out to customers and grow your business, but it only works if you can drive traffic back to your site.
That's why tracking open rates and click-through rates via email are so important - they give you a better idea about how engaged your leads are with your content.
If you notice that emails aren't being opened, then it's time to step back and see if there is anything wrong - like a broken image or too much text in the subject line.
On the other hand, if people ARE clicking through links but not engaging with your site (e.g., not purchasing anything), then you'll know that your content may be a little too "sales-y" or focused on the wrong things.
By tracking open and click rates, you can get more information on what's working well for your business, which allows you to better refine future campaigns moving forward.
6) Cost per Conversion or
At the end of every month (and even at the end of every week), it's important to look back and see what your marketing budget was for that time period.
Once you know how much money you spent, then divide that number by conversions or leads - this will give you a cost per conversion/lead rate.
For example: if you spent $100 and got ten leads, then your conversion rate would be $10 per lead (or cost per conversion).
This is a great metric to look at because it helps show how effective your marketing efforts are over time.
If the numbers continue to go down or stay flat, then it's clear that something needs to change.
However, if your conversion rates are increasing or going up over time, then you know that you're on the right track and should continue doing more of whatever it is making these numbers rise.
Pro-Tip: Calculate your customer's lifetime value to determine if your lead generation strategy is costing too much.
If you can convert new leads for $10, but each customer will be worth $150 on average, then you can feel confident about seeing a good ROI.
If, on the other hand, it costs $200 to get a quality led but your customer's lifetime value is, on average, $150, then you know that your marketing strategy is sinking money.
Get clear on your cost per conversion to help you determine if you're staying under budget.
7) Churn Rates

Lastly, it's important to look at churn rates. This will help you determine if your current customer base is growing or shrinking over time.
If the number of customers who cancel their services from month-to-month is consistently increasing, then something needs to change in order to bring these numbers back down (e.g., provide better customer service, improve the user experience, etc.).
If, on the other hand, those numbers are staying steady or even going down (e.g., customers who cancel their service from month-to-month is decreasing), then you know that your marketing strategy is working well and bringing in quality leads over time.
Remember, sometimes making your company more profitable can be done simply by losing less money over time (rather than generating new income).
That's why it's so important that you track your churn rates along with your new converisons.
Now that we've seen the 7 KPIs you need for your CMO dashboard, let's look at the easiest way to track this data.
How to Make a CMO Dashboard
Before we dive into this section, I should make something clear: I'm a bit biased against marketing dashboards.
It's not that I think they're useless - in fact, I think they can be very handy! So what's the problem?
Well, there are 2 concerns:
They require user role management
They often don't get used
The first concern is more of a problem if you're sharing your CMO dashboard with your team or clients.
It can be annoying to assign new user roles, manage sub-accounts, and remove access from old clients.
It's annoying, but probably not a deal breaker. But the second concern is a BIG problem:
Using CMO dashboards often leads to data getting compiled but never used. That's because many marketers don't make it a habit to check in with their data until there's a problem.
But if you're only seeing the data when there's a problem, then it's already too late and you've fallen behind the most efficient solutions.
That's why I always suggest CMOs make their marketing reports in the form of emails with a tool like Metrics Watch:
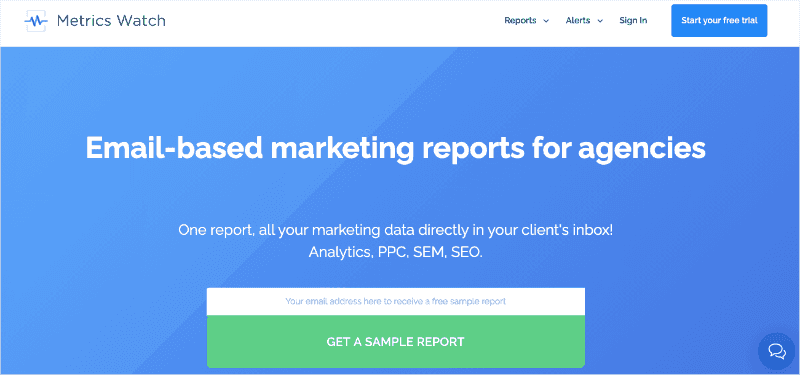
Metrics Watch is the perfect report building tool for CMOs. Not only is it easy to set up and get started, but it connects with your favorite marketing channels, such as:
Google Analytics
Google Search Console
Google Ads
Facebook
Instagram
LinkedIn
Mailchimp
This allows you to build comprehensive reports with all the KPIs you'd add to your CMO dashboard.
But instead of manually logging in to your account to view the data, these KPIs are sent directly to your inbox.
That means no more PDFs to manage or passwords to remember. Instead, you get all the data you need in a format you already know and love: email.
These articles will have even more information you need to make smarter, data-driven marketing reports.
And that's all for today! These have been 7 KPIs that you should consider adding to any CMO dashboard.
Sending these reports to clients? Not a problem. You can remove all Metrics Watch branding and add your own for a full white-label solution.
I hope you enjoyed this post. If you did, you definitely don't want to miss the following resources:
How to Set Up Custom Google Analytics Alerts to Avoid Lost Sales
How to Create a Social Media Audit (& the KPIs You Should Track)
Why not see for yourself the magic of Metrics Watch by clicking below and starting your 100% risk-free trial today (no credit card required):
Are you wondering which metrics belong in your Chief Marketing Officer (CMO) dashboard?
Creating a weekly or monthly marketing report is essential for CMOs in any niche. These reports let you know which of your marketing strategies are on track and which ones could use a little work.
That's why, in today's post, we're going to look at 7 KPIs every CMO dashboard or marketing report should track.
But first, let's get clear on what a CMO is and why their role absolutely requires custom reports.
What Is a Chief Marketing Officer (CMO)?
A CMO is the chief executive officer for all marketing efforts. Their goal is to increase awareness of their company and its products, as well as gain new customers.
While this responsibility varies widely from industry to industry, CMOs need a consistent way to measure how effective they are at reaching those goals - which means reports every week or month.
This is where a CMO dashboard comes in.
A CMO dashboard is exactly what it sounds like: it's a collection of KPIs that are specifically catered to the role.
Having access to these KPIs is crucial for the success of any CMO. Why? Because these marketing reports:
Highlight your weaknesses
Let you double-down on your strengths
Keep your team under budget
Justify your role to clients or upper management
At the end of the day, there's simply no reason for leaving your marketing strategy up to "your gut."
Instead, you simply need to track the right KPIs to make sure you're on the track.
With that in mind, let's look at some common KPIs every CMO should add to their dashboard or marketing report.
7 KPIs for Your CMO Dashboard
1) Pageviews
We'll start with the most basic of all metrics: pageviews.
While traffic is always a great metric to track, it's important not to get caught in a trap. Why? Because traffic can be deceiving - and sometimes you have no idea why your site has more or less visitors than normal.
That said, pageviews are important because they tell investors and clients just how many people you have a chance of reaching - and that's exactly what you want to show them.
If your pageviews go up, it means more people are seeing your site and interacting with your content, which is a great thing for any CMO looking to increase their presence online.
On the flip side, if pageviews decline or stagnate, then there may be an issue with your content. If you're struggling with this, schedule a meeting with your team to get some feedback on what may have changed about your marketing strategy that caused the decline in traffic.
The point is that this KPI gives you a general idea about whether your online presence is growing or decreasing.
Once pageviews are up and steady, then it's time to move onto new vs. returning visitors.
2) New vs. Returning Visitors
Every marketer knows that it's harder to convert new visitors than returning ones.
That said, if your site has a low percentage of new visitors compared to returning ones, you may want to look at how often you send out promotional emails or newsletters.
If the answer is "not enough," then take some time this month to schedule more outreach emails.
If, however, your site has a high percentage of new visitors every month or week, then you need to look at why that's happening - and what changes can be made to reduce the number of first-time visitors.
For example: is there something wrong with your website? Are people just stumbling across it? Or is your content so good that new people are converting faster than ever before?
There's no right answer to this question, but it gives you the data you need to stay ahead of what's working and what isn't.
3) Conversion Rates
Every marketer wants to increase their conversion rate, as it means that your company is converting more visitors into customers.
The problem with this metric: oftentimes entrepreneurs and marketers neglect to track the right metrics in order to get a full picture of what's working and what isn't - which can lead to wasted time or money down the line.
If you're looking to increase your conversion rate, then it's important to know what steps led up to a customer signing up for (or purchasing) something from your site.
For example: did they visit the product page? Did they sign up for an email list before making their purchase? Or did they only read three blog posts before signing up?
As you can see, there are a number of factors that go into increasing your conversion rate. That makes it even more important to track the right metrics in order to determine what works and what doesn't.
Once you've found which pieces of content work best at converting visitors into customers (and getting them to stick around), then you'll know what types of content to focus on moving forward.
4) Social Media Engagement and Growth
Every marketer is always looking for ways to get more engagement on social media, but it can be difficult to track which channels are the most effective at getting your content out there.
That's where tracking the following metrics comes into play:
Total likes
Followers
Shares
And more...
For example: if you want to increase brand awareness for your company, then tracking likes and shares is a great place to start.
However, if you're looking to drive more traffic back to your site or generate leads through social media (by sharing blog posts), then focus on measuring followers instead of just engagement rates.
The last thing any CMO wants is for their marketing team isn't gaining any traction on social media.
That's why it's important to take the time every month or so and track your growth rates across all channels - that way, you can determine which ones are bringing in the most traffic (and growing at a steady pace).
For this to work for YOUR business, though, you'll need to get clear on your social media goals.
Then you can better determine which KPI will best reflect the success of your social media strategy.
5) Email Open and Click-Through Rates
Email marketing is still one of the most effective ways to reach out to customers and grow your business, but it only works if you can drive traffic back to your site.
That's why tracking open rates and click-through rates via email are so important - they give you a better idea about how engaged your leads are with your content.
If you notice that emails aren't being opened, then it's time to step back and see if there is anything wrong - like a broken image or too much text in the subject line.
On the other hand, if people ARE clicking through links but not engaging with your site (e.g., not purchasing anything), then you'll know that your content may be a little too "sales-y" or focused on the wrong things.
By tracking open and click rates, you can get more information on what's working well for your business, which allows you to better refine future campaigns moving forward.
6) Cost per Conversion or
At the end of every month (and even at the end of every week), it's important to look back and see what your marketing budget was for that time period.
Once you know how much money you spent, then divide that number by conversions or leads - this will give you a cost per conversion/lead rate.
For example: if you spent $100 and got ten leads, then your conversion rate would be $10 per lead (or cost per conversion).
This is a great metric to look at because it helps show how effective your marketing efforts are over time.
If the numbers continue to go down or stay flat, then it's clear that something needs to change.
However, if your conversion rates are increasing or going up over time, then you know that you're on the right track and should continue doing more of whatever it is making these numbers rise.
Pro-Tip: Calculate your customer's lifetime value to determine if your lead generation strategy is costing too much.
If you can convert new leads for $10, but each customer will be worth $150 on average, then you can feel confident about seeing a good ROI.
If, on the other hand, it costs $200 to get a quality led but your customer's lifetime value is, on average, $150, then you know that your marketing strategy is sinking money.
Get clear on your cost per conversion to help you determine if you're staying under budget.
7) Churn Rates
Lastly, it's important to look at churn rates. This will help you determine if your current customer base is growing or shrinking over time.
If the number of customers who cancel their services from month-to-month is consistently increasing, then something needs to change in order to bring these numbers back down (e.g., provide better customer service, improve the user experience, etc.).
If, on the other hand, those numbers are staying steady or even going down (e.g., customers who cancel their service from month-to-month is decreasing), then you know that your marketing strategy is working well and bringing in quality leads over time.
Remember, sometimes making your company more profitable can be done simply by losing less money over time (rather than generating new income).
That's why it's so important that you track your churn rates along with your new converisons.
Now that we've seen the 7 KPIs you need for your CMO dashboard, let's look at the easiest way to track this data.
How to Make a CMO Dashboard
Before we dive into this section, I should make something clear: I'm a bit biased against marketing dashboards.
It's not that I think they're useless - in fact, I think they can be very handy! So what's the problem?
Well, there are 2 concerns:
They require user role management
They often don't get used
The first concern is more of a problem if you're sharing your CMO dashboard with your team or clients.
It can be annoying to assign new user roles, manage sub-accounts, and remove access from old clients.
It's annoying, but probably not a deal breaker. But the second concern is a BIG problem:
Using CMO dashboards often leads to data getting compiled but never used. That's because many marketers don't make it a habit to check in with their data until there's a problem.
But if you're only seeing the data when there's a problem, then it's already too late and you've fallen behind the most efficient solutions.
That's why I always suggest CMOs make their marketing reports in the form of emails with a tool like Metrics Watch:
Metrics Watch is the perfect report building tool for CMOs. Not only is it easy to set up and get started, but it connects with your favorite marketing channels, such as:
Google Analytics
Google Search Console
Google Ads
Facebook
Instagram
LinkedIn
Mailchimp
This allows you to build comprehensive reports with all the KPIs you'd add to your CMO dashboard.
But instead of manually logging in to your account to view the data, these KPIs are sent directly to your inbox.
That means no more PDFs to manage or passwords to remember. Instead, you get all the data you need in a format you already know and love: email.
These articles will have even more information you need to make smarter, data-driven marketing reports.
And that's all for today! These have been 7 KPIs that you should consider adding to any CMO dashboard.
Sending these reports to clients? Not a problem. You can remove all Metrics Watch branding and add your own for a full white-label solution.
I hope you enjoyed this post. If you did, you definitely don't want to miss the following resources:
How to Set Up Custom Google Analytics Alerts to Avoid Lost Sales
How to Create a Social Media Audit (& the KPIs You Should Track)
Why not see for yourself the magic of Metrics Watch by clicking below and starting your 100% risk-free trial today (no credit card required):
Start sending automated reports today
Start your free trial, no credit card required!
or
Start sending automated reports today
Start sending automated reports today
Start your free trial, no credit card required!
or