
Influencer Marketing Dashboards: What They Are (& How to Make One)
Influencer Marketing Dashboards: What They Are (& How to Make One)
Influencer Marketing Dashboards: What They Are (& How to Make One)
Do you want to build an influencer marketing dashboard, but don’t know where to begin?
Having a dedicated dashboard allows you to track the performance of your influencer campaigns. They let you see which partnerships and content are working and which ones aren’t, helping you save time and money.
But building these dashboards the right way isn’t always so obvious.
That’s why today, we’ll teach you how to make an effective dashboard to track your social media influencer partnerships in just 5 steps.
But before we delve in, let’s take a quick look at what they are and why they matter.
What Is an Influencer Marketing Dashboard?
An influencer marketing dashboard helps you track the performance and ROI of your social media influencer partnerships so you can measure the impact each one has on your business.
It measures the performance of an influencer by showing which campaigns they ran for your brand and how effective they were at generating sales or brand awareness.
So, why do you need an influencer marketing dashboard?
When you're paying someone to promote your business, you need to know who is hurting your business’ efforts to gain new customers and who is helping.
Tracking your key metrics with an influencer marketing dashboard will help you determine which influencers are performing well and which ones aren't, allowing you to allocate more of your budget to the ones that are producing a positive ROI.

How to Build an Influencer Marketing Dashboard
Now that we know what an influencer marketing dashboard is and why they’re important, let’s take a look at the 5 steps you’ll need to build your own (the right way).
Whether you're building a dashboard manually in a spreadsheet or using an automated dashboard tool, these steps will help you create reports that are insightful and actionable.
Step 1: Set Your Objective
Before you decide which metrics to track, you need to establish your primary goal or objective.
Otherwise, your dashboard could contain useless or even too much information, making it harder to understand and act on your data.
Are you trying to raise brand awareness?
Are you trying to increase sales?
Setting a goal makes it easier to prioritize and identify metrics that are key performance indicators (KPIs) - the data you need to track to determine the success or failure of a campaign.
Step 2: Determine Your KPIs
The second step is choosing which KPIs to track based on your objective. These are the metrics that will be used to gauge how successful a campaign is.
Your dashboard should be easy for your team members or clients to understand and take action based on the data. So once you've chosen your KPIs, you want to limit them.
As a general guide, you should choose 3-5 high-impact KPIs for each influencer campaign that you're running.

Let's take a look at some example metrics you can track for brand awareness and sales/conversion growth campaigns:
Example #1: Influencer Marketing Dashboard for Brand Awareness
Reach & impressions
Engagement rate
Audience growth rate
Cost per post
Total amount spent on influencer marketing efforts
Tracking the engagement rate, reach, and impressions of social media posts will let you see whether your social influencer content strategy is reaching a wider audience or not.
It's important to track your total amount spent and cost per post. If you're working with a limited budget, you'll need to identify which influencer profiles are giving you the best bag for your buck (so long as they're reaching your target audience).
It can also be useful to keep an eye on your brand mentions to measure the response of your influencer's followers. But remember; not all users will tag you or use your branded hashtags. Social listening tools like Mention will track this for you automatically, or you can search manually on social networks.
Example #2: Influencer Marketing Dashboard for Sales Growth
Referral traffic
Conversions
Revenue
ROI of influencer marketing
Total amount spent
When your goal is to increase sales or conversions, you need to keep a close eye on money in vs money out to see if you're achieving a positive ROI from your influencer marketing campaigns.
Tracking your traffic, conversions, and revenue from social platforms is a good start, but you'll also need to filter this data to separate general social media users from influencer referrals. Which leads us to the next step...
Step 3: Set Up Your Tracking Links
If you want to calculate your influencer marketing ROI, you need to be able to track their referral traffic accurately. The best way to do this is using UTMs.
A UTM parameter is a small piece of code attached to the end of a URL to track the performance of campaigns. Here's an example:
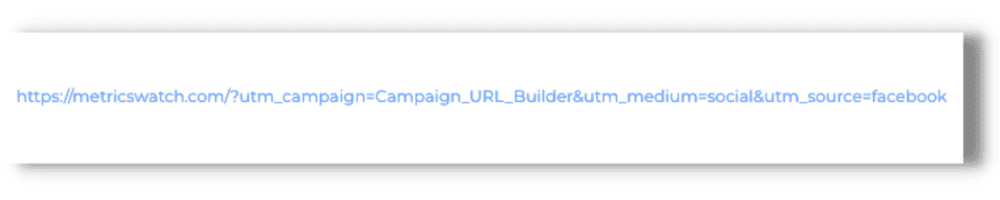
This makes it possible for web analytics tools like Google Analytics to identify referral traffic sources more accurately, letting you measure exactly how many website visitors and conversions are attributed to a specific influencer or specific post.
To set up tracking links for your influencer posts, you can either use Google's free Campaign URL Builder or a tool like utm.io.
Another way to track referrals from your influencer marketing efforts is by using affiliate links or discount codes.
These take more time to set up and manage but can provide a nice incentive for influencers to create more content for your brand and for their audience to answer calls to action.
🔎 Related: UTMs: What They Are And How To Use Them The Right Way
Step 4: Transform Numeric Data into Visual Data
By far one of the most effective things you can do to make your reporting easier to read is to display your data visually with charts and graphs.
This gives your data visual context that marketing teams and clients can use to measure their marketing efforts clearly. And when reports are easy to read, it's easier to take action.
For example, let's say you want to show a client much website traffic a campaign has generated. Instead of just giving them a list of numbers, you can present the data visually as a graph:
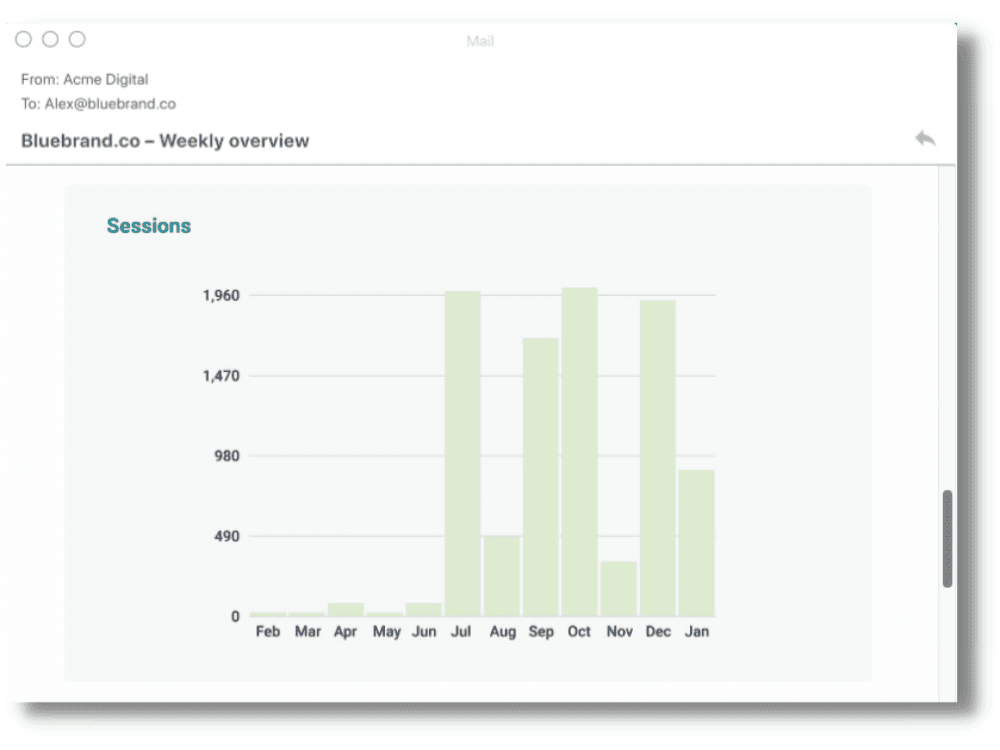
This makes it easy to spot trends at a glance... not to mention your data looks less boring (and nobody is going to look forward to receiving dull reports)
If possible, you should try to visualize as much data as possible to increase the chance of the person reading your report understanding it and knowing what action needs to be taken.
Step 5: Set Up Automated Reports
Dashboards are designed to help you quickly see how your strategy is performing across multiple social channels.
Whether your strategy involves leveraging high-demand content creators or smaller 'micro-influencers', the cost can add up quickly, especially when running multiple campaigns at the same time.
To achieve a positive ROI, you need to identify proftable and nonprofitable campaigns early to keep your marketing budget optimized.
The main drawback of manually tracking your data in a spreadsheet or using and dashboard tool is that you have to remember to go and check your data (which is all too easy to forget about with a busy schedule).
This is why automated reports are so valuable - helping you save time and money by ensuring you have the data you need when you need it.
And for that, there's no better tool than Metrics Watch:
Metrics Watch lets you fully automate your reporting process, so you can spend less time making reports and more time marketing.
Build professional marketing reports with ease using a codeless drag-and-drop editor then schedule them to be sent daily, weekly, or monthly to meet the needs of your team or clients.
Bring your data to life with graphs and charts! Insights are also added automatically to quickly see how your data has changed since your last report.
Metrics Watch connects with your favorite marketing channels and social media platforms:
Google Analytics
Google Ads
Facebook
Instagram
LinkedIn
Mailchimp
And more...
This lets you create comprehensive reports to see compare how your influencer marketing strategy measures up alongside your other efforts.
But the best thing about Metrics Watch is how your data is shared...
Reports are displayed in the body of the email itself, eliminating all friction between marketers and their data. This means:
No need to download pesky PDF attachments
No need to log in to 3rd-party dashboards
Instead, colleagues and clients can easily access all their key marketing information using a format they already know and use every day: email.
And that's it for today! We hope that you now have a better understanding of what an influencer marketing dashboard is and how to make one to track your own efforts.
If you enjoyed this post, be sure to check out these other articles:
These additional resources have even more useful information to help agencies and marketers make better use of their data by building effective, actionable reports.
Want to try Metrics Watch for yourself?
Start your free trial of Metrics Watch today - no credit card required!
Do you want to build an influencer marketing dashboard, but don’t know where to begin?
Having a dedicated dashboard allows you to track the performance of your influencer campaigns. They let you see which partnerships and content are working and which ones aren’t, helping you save time and money.
But building these dashboards the right way isn’t always so obvious.
That’s why today, we’ll teach you how to make an effective dashboard to track your social media influencer partnerships in just 5 steps.
But before we delve in, let’s take a quick look at what they are and why they matter.
What Is an Influencer Marketing Dashboard?
An influencer marketing dashboard helps you track the performance and ROI of your social media influencer partnerships so you can measure the impact each one has on your business.
It measures the performance of an influencer by showing which campaigns they ran for your brand and how effective they were at generating sales or brand awareness.
So, why do you need an influencer marketing dashboard?
When you're paying someone to promote your business, you need to know who is hurting your business’ efforts to gain new customers and who is helping.
Tracking your key metrics with an influencer marketing dashboard will help you determine which influencers are performing well and which ones aren't, allowing you to allocate more of your budget to the ones that are producing a positive ROI.
How to Build an Influencer Marketing Dashboard
Now that we know what an influencer marketing dashboard is and why they’re important, let’s take a look at the 5 steps you’ll need to build your own (the right way).
Whether you're building a dashboard manually in a spreadsheet or using an automated dashboard tool, these steps will help you create reports that are insightful and actionable.
Step 1: Set Your Objective
Before you decide which metrics to track, you need to establish your primary goal or objective.
Otherwise, your dashboard could contain useless or even too much information, making it harder to understand and act on your data.
Are you trying to raise brand awareness?
Are you trying to increase sales?
Setting a goal makes it easier to prioritize and identify metrics that are key performance indicators (KPIs) - the data you need to track to determine the success or failure of a campaign.
Step 2: Determine Your KPIs
The second step is choosing which KPIs to track based on your objective. These are the metrics that will be used to gauge how successful a campaign is.
Your dashboard should be easy for your team members or clients to understand and take action based on the data. So once you've chosen your KPIs, you want to limit them.
As a general guide, you should choose 3-5 high-impact KPIs for each influencer campaign that you're running.
Let's take a look at some example metrics you can track for brand awareness and sales/conversion growth campaigns:
Example #1: Influencer Marketing Dashboard for Brand Awareness
Reach & impressions
Engagement rate
Audience growth rate
Cost per post
Total amount spent on influencer marketing efforts
Tracking the engagement rate, reach, and impressions of social media posts will let you see whether your social influencer content strategy is reaching a wider audience or not.
It's important to track your total amount spent and cost per post. If you're working with a limited budget, you'll need to identify which influencer profiles are giving you the best bag for your buck (so long as they're reaching your target audience).
It can also be useful to keep an eye on your brand mentions to measure the response of your influencer's followers. But remember; not all users will tag you or use your branded hashtags. Social listening tools like Mention will track this for you automatically, or you can search manually on social networks.
Example #2: Influencer Marketing Dashboard for Sales Growth
Referral traffic
Conversions
Revenue
ROI of influencer marketing
Total amount spent
When your goal is to increase sales or conversions, you need to keep a close eye on money in vs money out to see if you're achieving a positive ROI from your influencer marketing campaigns.
Tracking your traffic, conversions, and revenue from social platforms is a good start, but you'll also need to filter this data to separate general social media users from influencer referrals. Which leads us to the next step...
Step 3: Set Up Your Tracking Links
If you want to calculate your influencer marketing ROI, you need to be able to track their referral traffic accurately. The best way to do this is using UTMs.
A UTM parameter is a small piece of code attached to the end of a URL to track the performance of campaigns. Here's an example:
This makes it possible for web analytics tools like Google Analytics to identify referral traffic sources more accurately, letting you measure exactly how many website visitors and conversions are attributed to a specific influencer or specific post.
To set up tracking links for your influencer posts, you can either use Google's free Campaign URL Builder or a tool like utm.io.
Another way to track referrals from your influencer marketing efforts is by using affiliate links or discount codes.
These take more time to set up and manage but can provide a nice incentive for influencers to create more content for your brand and for their audience to answer calls to action.
🔎 Related: UTMs: What They Are And How To Use Them The Right Way
Step 4: Transform Numeric Data into Visual Data
By far one of the most effective things you can do to make your reporting easier to read is to display your data visually with charts and graphs.
This gives your data visual context that marketing teams and clients can use to measure their marketing efforts clearly. And when reports are easy to read, it's easier to take action.
For example, let's say you want to show a client much website traffic a campaign has generated. Instead of just giving them a list of numbers, you can present the data visually as a graph:
This makes it easy to spot trends at a glance... not to mention your data looks less boring (and nobody is going to look forward to receiving dull reports)
If possible, you should try to visualize as much data as possible to increase the chance of the person reading your report understanding it and knowing what action needs to be taken.
Step 5: Set Up Automated Reports
Dashboards are designed to help you quickly see how your strategy is performing across multiple social channels.
Whether your strategy involves leveraging high-demand content creators or smaller 'micro-influencers', the cost can add up quickly, especially when running multiple campaigns at the same time.
To achieve a positive ROI, you need to identify proftable and nonprofitable campaigns early to keep your marketing budget optimized.
The main drawback of manually tracking your data in a spreadsheet or using and dashboard tool is that you have to remember to go and check your data (which is all too easy to forget about with a busy schedule).
This is why automated reports are so valuable - helping you save time and money by ensuring you have the data you need when you need it.
And for that, there's no better tool than Metrics Watch:
Metrics Watch lets you fully automate your reporting process, so you can spend less time making reports and more time marketing.
Build professional marketing reports with ease using a codeless drag-and-drop editor then schedule them to be sent daily, weekly, or monthly to meet the needs of your team or clients.
Bring your data to life with graphs and charts! Insights are also added automatically to quickly see how your data has changed since your last report.
Metrics Watch connects with your favorite marketing channels and social media platforms:
Google Analytics
Google Ads
Facebook
Instagram
LinkedIn
Mailchimp
And more...
This lets you create comprehensive reports to see compare how your influencer marketing strategy measures up alongside your other efforts.
But the best thing about Metrics Watch is how your data is shared...
Reports are displayed in the body of the email itself, eliminating all friction between marketers and their data. This means:
No need to download pesky PDF attachments
No need to log in to 3rd-party dashboards
Instead, colleagues and clients can easily access all their key marketing information using a format they already know and use every day: email.
And that's it for today! We hope that you now have a better understanding of what an influencer marketing dashboard is and how to make one to track your own efforts.
If you enjoyed this post, be sure to check out these other articles:
These additional resources have even more useful information to help agencies and marketers make better use of their data by building effective, actionable reports.
Want to try Metrics Watch for yourself?
Start your free trial of Metrics Watch today - no credit card required!
Start sending automated reports today
Start your free trial, no credit card required!
or
Start sending automated reports today
Start sending automated reports today
Start your free trial, no credit card required!
or