
Ecommerce Marketing Reports Made Simple: 8 KPIs to Track
Ecommerce Marketing Reports Made Simple: 8 KPIs to Track
Ecommerce Marketing Reports Made Simple: 8 KPIs to Track
Are you trying to build an eCommerce marketing report, but not sure what KPIs to include?
Let’s be honest: the world of eCommerce can be competitive and tedious. Plus, there seems to be a never-ending “to-do” list to keep track of.
The best way to grow your online store is to first understand how your users interact with it. And for that, you need to have reliable and accurate data.
That’s why, in today’s post, I’m going to teach you what KPIs to add to your eCommerce marketing report.
Then, at the end of this article, we’ll cover the best way to automate the entire system so you have one less thing to think about.
Ready to get started? Let’s dive straight into the list.
KPIs for Your Ecommerce Marketing Reports
1) Total Website Visits

Although social media platforms increasingly offer tools to sell directly on their sites, most eCommerce stores still rely on getting people onto their websites to make sales. So, your overall website traffic is a vital KPI to include in your eCommerce marketing reports.
You are interested in three main things with this KPI. First, you want to see the long-term trends. The number of visitors will vary daily, but you want to see the average amount increasing over time to know that your digital marketing efforts are paying off.
Secondly, you want to uncover the natural weekly and seasonal trends to help you plan your campaigns. Black Friday and before major holidays are times most eCommerce stores expect to see a jump, for example.
And depending on the nature of your store, you might see higher sales at weekends or on certain weekdays.
Thirdly, when you launch a marketing campaign, you want to see a corresponding jump in website visits.
2) New vs Returning Visitors
For your eCommerce store to grow, you need to attract new customers. But acquiring new customers costs more than retaining existing ones – anything from 5 to 25 times more, according to the Harvard Business Review.
Ideally, you want to track both new and returning visitors to your eCommerce site. This helps you to evaluate the success of your acquisition and your retargeting campaigns.
So, break your website traffic down into new and returning visitors and include these figures in your eCommerce marketing report.
3) Organic Traffic
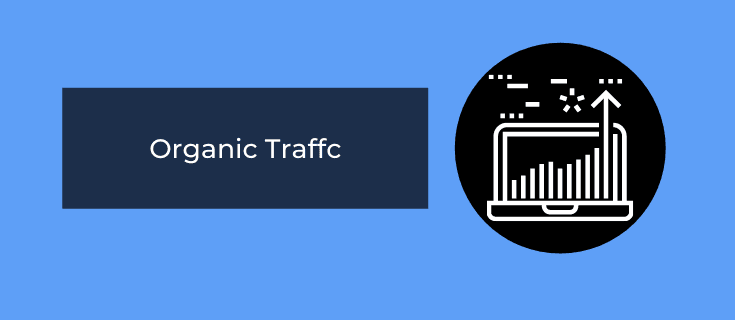
Your eCommerce store is hopefully making the most of its budget and exploring a wide range of marketing channels. But we all secretly hope that customers will come to us themselves, so we don’t have to spend time and $$$ tempting them in.
Your organic traffic is a great indicator that your SEO efforts are paying off. It also suggests that people want what you are selling, which is always reassuring.
Like your overall website traffic, what you are interested in here is the long-term trends, as well as any particularly sharp peaks or dips.
4) Traffic Sources & Revenue
Organic traffic is one thing. But you also want to know where your other visitors are coming from, especially if you are investing in paid advertising.
Knowing which channels and campaigns bring you the most traffic can help you plan your marketing strategy and allocate your budget appropriately.
However, quantity doesn’t necessarily equal quality. 100 customers who spend $20 each with you are worth less than 50 customers who spend $50 each. So, you’ll want to include revenue by traffic source too.
Don’t forget to set up some UTMs in Google Analytics to help you accurately attribute visitors and purchases to the correct campaign and referring platform. Not sure what a UTM is or why you need them? We explain that in more detail here.
5) Conversion Rate
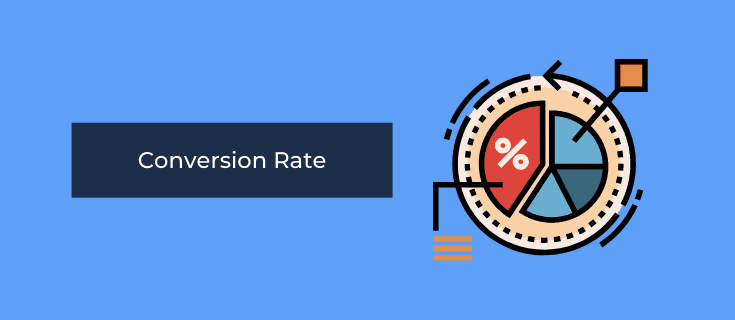
The conversion rate is the percentage of visitors to your eCommerce website who then completed the action you wanted them to take.
For most eCommerce stores, that action will be completing a purchase. However, you may want to set some lower priority goals around things like mailing list subscriptions too.
This is an essential KPI to include in your weekly and/or monthly eCommerce marketing reports. It tells you whether your landing pages and product descriptions are doing a good job of convincing people to buy once they are on your site.
It also indicates whether you are reaching the right people with your marketing campaigns. A high click-through rate but a low conversion rate on campaigns might suggest you need to revisit your buyer personas.
6) Cost-per-Acquisition
Ultimately, your eCommerce store needs to make a profit, or it won’t be open for very long. This makes the cost-per-acquisition (CPA) a vital KPI to include in your marketing reports.
If you spend too much money acquiring new customers, you’ll cut into your profit margins and make it hard to keep going in the long term.
Some channels have a better CPA than others. Knowing which marketing platforms bring you customers without too much expenditure helps you plan where to concentrate your efforts in the future.
It is also an integral metric for evaluating the success (or otherwise) of your individual digital marketing campaigns.
Some channels give you this information automatically. For those that don’t, use the total cost of the campaign/number of customers acquired.
7) Top Landing Pages

Getting people to your eCommerce website is just the first step. You still need to convince them to make a purchase, which is where a persuasive, well-designed landing page comes in.
Your eCommerce marketing reports should track which landing pages get the most visitors and which have the highest conversion rates.
This tells you a lot about your target audience, including what language, images, and design they respond to best and whether you’re successfully targeting the right keywords with the right landing pages.
8) Abandoned Cart Rate
The abandoned cart rate is the percentage of people who start the checkout process and then don’t complete their purchase. It can be terrifyingly high, so getting this down is often a pressing concern for eCommerce stores.
Now, you could argue that this KPI is more of a concern for your UX designer (if you have one) or whoever looks after your checkout process. And yes, a smoother checkout experience can help to reduce cart abandonment rates.
But it is a vital KPI for marketing teams too. You need to know how much heavy lifting your retargeting campaigns need to do to get people across the finish line. This helps you plan your budget accordingly.
A high cart abandonment rate can also indicate you need to revisit your landing pages and product descriptions. Are they compelling enough? Would a strategic first-time buyers’ discount make the difference?
BONUS: Most Popular Products
This is less of a KPI and more of a “nice to know.”
Understanding which products are your bestsellers is a concern for more than just the purchasing team. It’s an essential piece of information for the marketing team too.
If you know what is selling well, you can plan the focus of your campaigns accordingly. So, you will probably find it helpful to include this information in your weekly or monthly eCommerce marketing reports.
But, again, this isn’t a marketing KPI, however.
Why? Because it isn’t something that indicates whether your eCommerce store is on track to reach its goals or not. If you’d like more of an explanation of what a KPI is (and isn’t), check out our post on the KPIs that are valuable for a small business.
Ok, now that we know which KPIs you need to add to your eCommerce marketing reports, let’s quickly go over the best method for making one.
How to Automate Ecommerce Marketing Reports
When it comes to building your marketing reports, there’s really only 2 ways of going about it:
Manually
With an automated tool
While you might think you’re saving a bit of money by creating these reports by hand, here are a few things to keep in mind.
First, manually building your eCommerce reports is time-consuming. And whether you’re paying someone else or doing it yourself, you’re still paying for that time.
This can actually add up month after month and be MORE expensive than doing it by hand.
Second, creating marketing reports by hand is prone to human error. There’s no way to reliably verify the data was input correctly each week, so you could get a false sense of your store’s success (or failure).
Finally, report building is a never-ending process. By the time you’ve compiled this week’s data, it’s nearly time to start on the next.
That’s why I always recommend going with a tool like Metrics Watch:
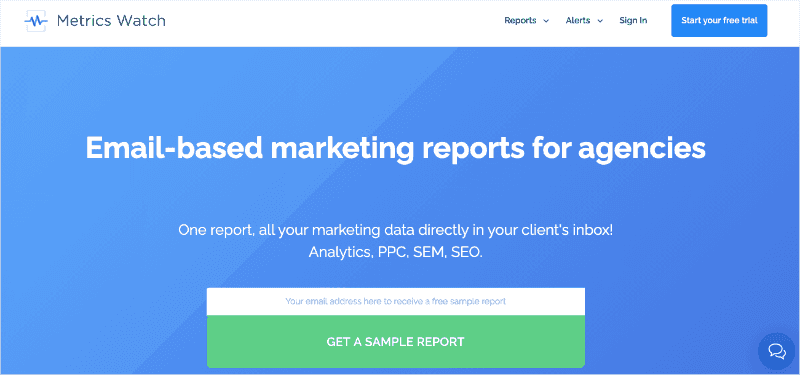
Metrics Watch is a report builder that allows you to create eCommerce marketing reports FAST.
There’s zero coding required, and you can get all of your marketing channels set up easily. These channels include things like:
Google Analytics
Google Search Console
Google Ads
Facebook (organic and paid ads)
Instagram (organic and paid ads)
LinkedIn (organic and paid ads)
And more…
Once these sources are integrated, you’ll be able to add all the eCommerce KPIs you need.
Then you can schedule the reports to be automatically sent once every day, week, or month. In other words, you can turn the entire process on auto-pilot.
But the best part is how this data is shared.
Unlike other report builders on the market, Metrics Watch sends your reports directly via email. NOT as a PDF attachment and NOT as a link to a 3rd-party dashboard.
Instead, these reports are sent directly to your recipients’ inbox with YOUR company’s logo and branding.
This makes Metrics Watch one of the most powerful, flexible, and simple report building tools on the market.
And that’s all for today! These have been 8 KPIs you need to add to your eCommerce marketing reports.
We hope you enjoyed this post. If you did, you’ll definitely want to check out the following resources:
These articles will have even more information that you can use to grow and scale your eCommerce store.
Want to see Metrics Watch for yourself at ZERO risk? Click below to start your 14-day risk-free Metrics Watch account today (no credit card need):
Are you trying to build an eCommerce marketing report, but not sure what KPIs to include?
Let’s be honest: the world of eCommerce can be competitive and tedious. Plus, there seems to be a never-ending “to-do” list to keep track of.
The best way to grow your online store is to first understand how your users interact with it. And for that, you need to have reliable and accurate data.
That’s why, in today’s post, I’m going to teach you what KPIs to add to your eCommerce marketing report.
Then, at the end of this article, we’ll cover the best way to automate the entire system so you have one less thing to think about.
Ready to get started? Let’s dive straight into the list.
KPIs for Your Ecommerce Marketing Reports
1) Total Website Visits
Although social media platforms increasingly offer tools to sell directly on their sites, most eCommerce stores still rely on getting people onto their websites to make sales. So, your overall website traffic is a vital KPI to include in your eCommerce marketing reports.
You are interested in three main things with this KPI. First, you want to see the long-term trends. The number of visitors will vary daily, but you want to see the average amount increasing over time to know that your digital marketing efforts are paying off.
Secondly, you want to uncover the natural weekly and seasonal trends to help you plan your campaigns. Black Friday and before major holidays are times most eCommerce stores expect to see a jump, for example.
And depending on the nature of your store, you might see higher sales at weekends or on certain weekdays.
Thirdly, when you launch a marketing campaign, you want to see a corresponding jump in website visits.
2) New vs Returning Visitors
For your eCommerce store to grow, you need to attract new customers. But acquiring new customers costs more than retaining existing ones – anything from 5 to 25 times more, according to the Harvard Business Review.
Ideally, you want to track both new and returning visitors to your eCommerce site. This helps you to evaluate the success of your acquisition and your retargeting campaigns.
So, break your website traffic down into new and returning visitors and include these figures in your eCommerce marketing report.
3) Organic Traffic
Your eCommerce store is hopefully making the most of its budget and exploring a wide range of marketing channels. But we all secretly hope that customers will come to us themselves, so we don’t have to spend time and $$$ tempting them in.
Your organic traffic is a great indicator that your SEO efforts are paying off. It also suggests that people want what you are selling, which is always reassuring.
Like your overall website traffic, what you are interested in here is the long-term trends, as well as any particularly sharp peaks or dips.
4) Traffic Sources & Revenue
Organic traffic is one thing. But you also want to know where your other visitors are coming from, especially if you are investing in paid advertising.
Knowing which channels and campaigns bring you the most traffic can help you plan your marketing strategy and allocate your budget appropriately.
However, quantity doesn’t necessarily equal quality. 100 customers who spend $20 each with you are worth less than 50 customers who spend $50 each. So, you’ll want to include revenue by traffic source too.
Don’t forget to set up some UTMs in Google Analytics to help you accurately attribute visitors and purchases to the correct campaign and referring platform. Not sure what a UTM is or why you need them? We explain that in more detail here.
5) Conversion Rate
The conversion rate is the percentage of visitors to your eCommerce website who then completed the action you wanted them to take.
For most eCommerce stores, that action will be completing a purchase. However, you may want to set some lower priority goals around things like mailing list subscriptions too.
This is an essential KPI to include in your weekly and/or monthly eCommerce marketing reports. It tells you whether your landing pages and product descriptions are doing a good job of convincing people to buy once they are on your site.
It also indicates whether you are reaching the right people with your marketing campaigns. A high click-through rate but a low conversion rate on campaigns might suggest you need to revisit your buyer personas.
6) Cost-per-Acquisition
Ultimately, your eCommerce store needs to make a profit, or it won’t be open for very long. This makes the cost-per-acquisition (CPA) a vital KPI to include in your marketing reports.
If you spend too much money acquiring new customers, you’ll cut into your profit margins and make it hard to keep going in the long term.
Some channels have a better CPA than others. Knowing which marketing platforms bring you customers without too much expenditure helps you plan where to concentrate your efforts in the future.
It is also an integral metric for evaluating the success (or otherwise) of your individual digital marketing campaigns.
Some channels give you this information automatically. For those that don’t, use the total cost of the campaign/number of customers acquired.
7) Top Landing Pages
Getting people to your eCommerce website is just the first step. You still need to convince them to make a purchase, which is where a persuasive, well-designed landing page comes in.
Your eCommerce marketing reports should track which landing pages get the most visitors and which have the highest conversion rates.
This tells you a lot about your target audience, including what language, images, and design they respond to best and whether you’re successfully targeting the right keywords with the right landing pages.
8) Abandoned Cart Rate
The abandoned cart rate is the percentage of people who start the checkout process and then don’t complete their purchase. It can be terrifyingly high, so getting this down is often a pressing concern for eCommerce stores.
Now, you could argue that this KPI is more of a concern for your UX designer (if you have one) or whoever looks after your checkout process. And yes, a smoother checkout experience can help to reduce cart abandonment rates.
But it is a vital KPI for marketing teams too. You need to know how much heavy lifting your retargeting campaigns need to do to get people across the finish line. This helps you plan your budget accordingly.
A high cart abandonment rate can also indicate you need to revisit your landing pages and product descriptions. Are they compelling enough? Would a strategic first-time buyers’ discount make the difference?
BONUS: Most Popular Products
This is less of a KPI and more of a “nice to know.”
Understanding which products are your bestsellers is a concern for more than just the purchasing team. It’s an essential piece of information for the marketing team too.
If you know what is selling well, you can plan the focus of your campaigns accordingly. So, you will probably find it helpful to include this information in your weekly or monthly eCommerce marketing reports.
But, again, this isn’t a marketing KPI, however.
Why? Because it isn’t something that indicates whether your eCommerce store is on track to reach its goals or not. If you’d like more of an explanation of what a KPI is (and isn’t), check out our post on the KPIs that are valuable for a small business.
Ok, now that we know which KPIs you need to add to your eCommerce marketing reports, let’s quickly go over the best method for making one.
How to Automate Ecommerce Marketing Reports
When it comes to building your marketing reports, there’s really only 2 ways of going about it:
Manually
With an automated tool
While you might think you’re saving a bit of money by creating these reports by hand, here are a few things to keep in mind.
First, manually building your eCommerce reports is time-consuming. And whether you’re paying someone else or doing it yourself, you’re still paying for that time.
This can actually add up month after month and be MORE expensive than doing it by hand.
Second, creating marketing reports by hand is prone to human error. There’s no way to reliably verify the data was input correctly each week, so you could get a false sense of your store’s success (or failure).
Finally, report building is a never-ending process. By the time you’ve compiled this week’s data, it’s nearly time to start on the next.
That’s why I always recommend going with a tool like Metrics Watch:
Metrics Watch is a report builder that allows you to create eCommerce marketing reports FAST.
There’s zero coding required, and you can get all of your marketing channels set up easily. These channels include things like:
Google Analytics
Google Search Console
Google Ads
Facebook (organic and paid ads)
Instagram (organic and paid ads)
LinkedIn (organic and paid ads)
And more…
Once these sources are integrated, you’ll be able to add all the eCommerce KPIs you need.
Then you can schedule the reports to be automatically sent once every day, week, or month. In other words, you can turn the entire process on auto-pilot.
But the best part is how this data is shared.
Unlike other report builders on the market, Metrics Watch sends your reports directly via email. NOT as a PDF attachment and NOT as a link to a 3rd-party dashboard.
Instead, these reports are sent directly to your recipients’ inbox with YOUR company’s logo and branding.
This makes Metrics Watch one of the most powerful, flexible, and simple report building tools on the market.
And that’s all for today! These have been 8 KPIs you need to add to your eCommerce marketing reports.
We hope you enjoyed this post. If you did, you’ll definitely want to check out the following resources:
These articles will have even more information that you can use to grow and scale your eCommerce store.
Want to see Metrics Watch for yourself at ZERO risk? Click below to start your 14-day risk-free Metrics Watch account today (no credit card need):
Start sending automated reports today
Start your free trial, no credit card required!
or
Start sending automated reports today
Start sending automated reports today
Start your free trial, no credit card required!
or